
Figures & data
Table 1. Anatomical total shoulder arthroplasty (TSA), resurfacing hemiarthroplasty (RHA), stemmed hemiarthroplasty (SHA), and reverse shoulder arthroplasty (RSA), number (%)
Figure 1. Annual number of shoulder arthroplasties for osteoarthritis from 2006 to 2015.
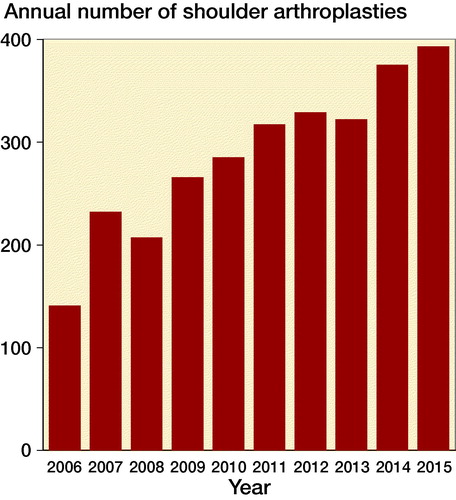
Figure 2. The proportion of stemmed hemiarthroplasty (blue), resurfacing hemiarthroplasty (green), anatomical total shoulder arthroplasty (purple), and reverse shoulder arthroplasty (grey) from 2006 to 2015.
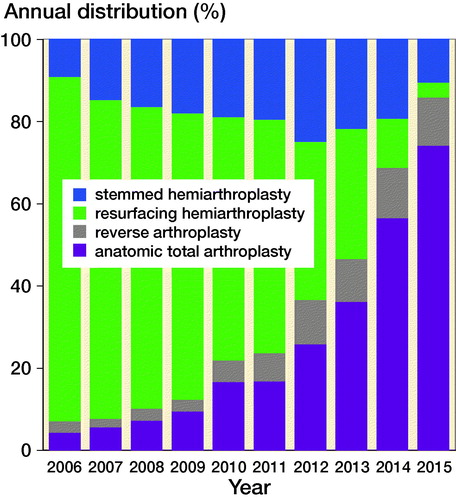
Figure 3. Proportion of patients who were 55 years or younger (dark green), between 56 and 74 years (light green), and 75 years or older (grey) from 2006 to 2015.
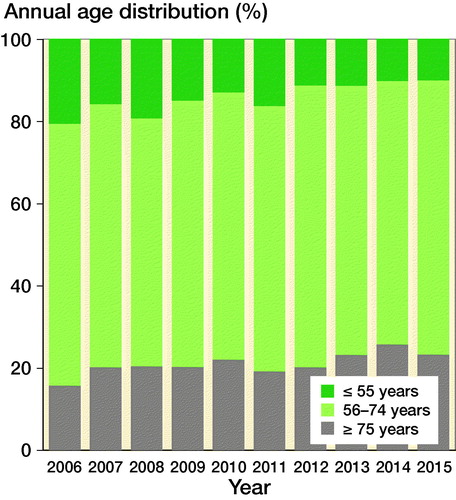
Table 2. Linear regression model with difference, 95% confidence interval (CI), and with WOOS at 1 year as the dependent variable