
Figures & data
Figure 1. Flowchart of patient selection.
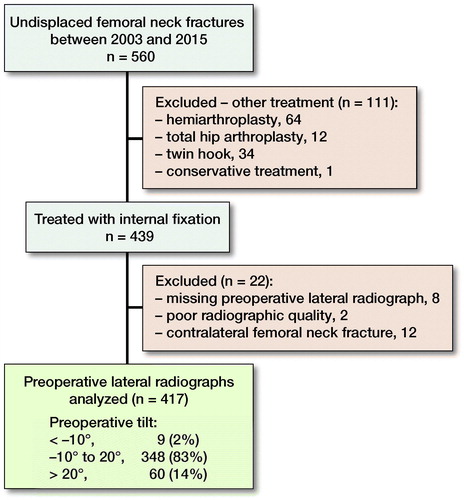
Table 1. Characteristics of patients (n = 417)
Figure 2. Diagram displaying the distribution of patients and treatment failure (n = 417).
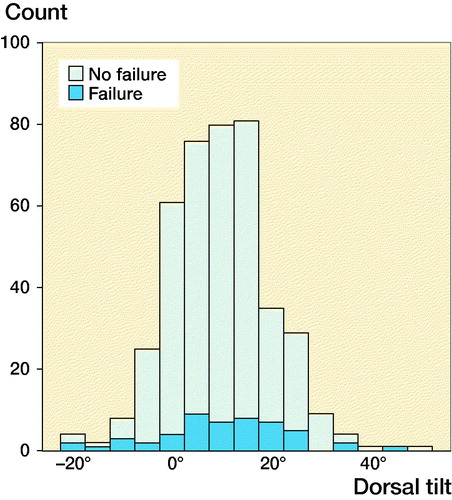
Table 2. Treatment failures and reoperations
Figure 3. Plot of the risk of treatment failure. Anterior tilt corresponds to negative values on the X-axis. Adjusted for sex, sheltered housing, cognitive impairment, implant angulation, and postoperative tilt. Light blue area corresponds to 95% CI.
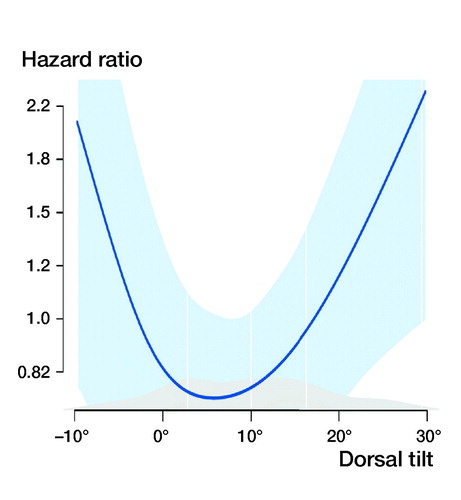
Table 3. Cox proportional hazard model for covariates associated with treatment failure adjusted for sex, sheltered housing, cognitive impairment, implant angulation, and postoperative tilt