
Figures & data
Table 1. Registry studies of TEA
Table 2. Data on 1,220 primary TEA
Figure 1. Primary total elbow replacement by primary diagnosis.
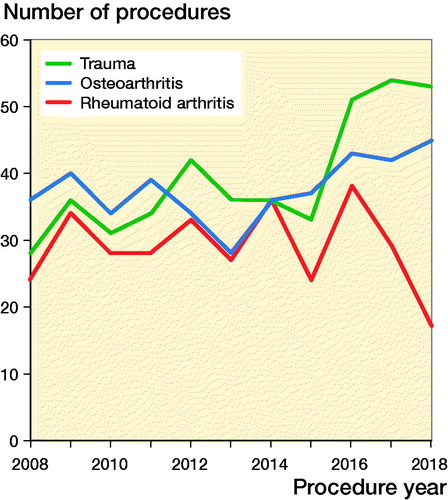
Figure 2. Cumulative percentage revision of primary total elbow replacement (all diagnoses).
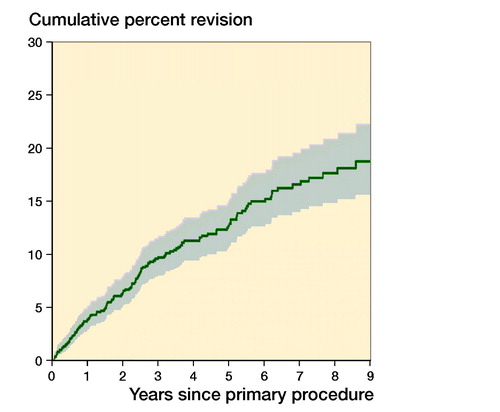
Figure 3. Cumulative percentage revision of primary total elbow replacement by primary diagnosis.
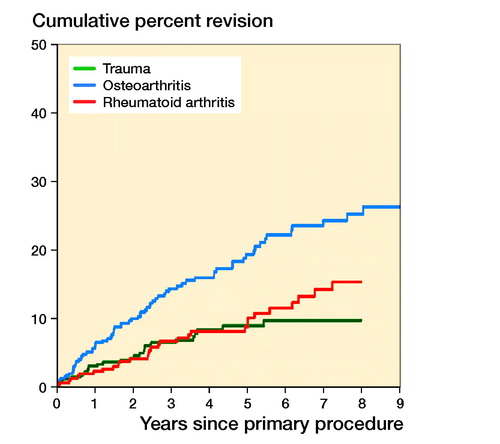
Table 4. Yearly unadjusted cumulative percentage revision (CPR (CI)) of primary total elbow replacement (all diagnoses)
Figure 4. Cumulative percentage revision of primary total elbow replacement by type of primary (all diagnoses). HR adjusted for age and sex for total elbow versus total elbow & radial, entired period: HR (CI) = 1.5 (0.7–2.9). Number at risk, see below.
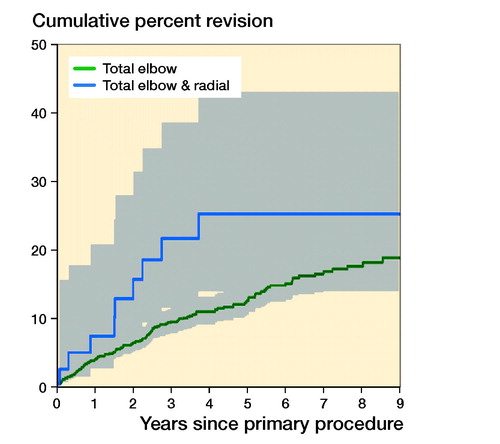
Figure 5. Cumulative percentage revision of primary total elbow replacement (all diagnoses). HR adjusted for age and sex for unlinked versus linked, 0–6 months: HR (CI) = 3.7 (0.9–15) and > 6 months: HR (CI) = 0.8 (0.2–2.4).
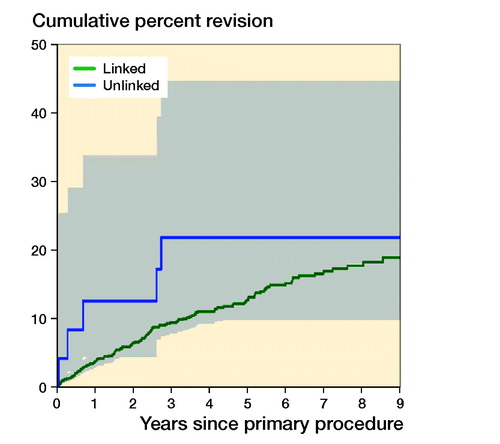
Figure 6. Cumulative percentage revision of primary total elbow replacement (all diagnoses). Only prostheses with over 100 procedures.
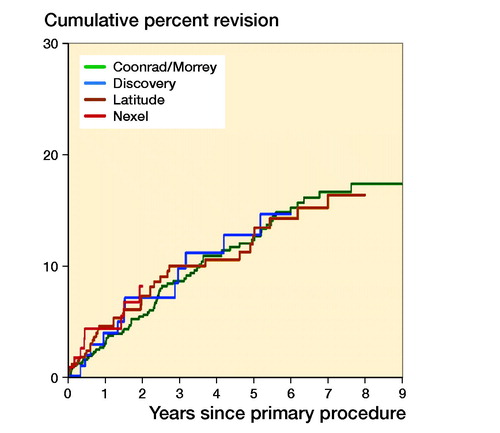
Table 5. Revision diagnosis of primary total elbow replacement by type of primary (all diagnoses). Values are frequency