Figures & data
Figure 1. Overview of the experimental design used in the study.
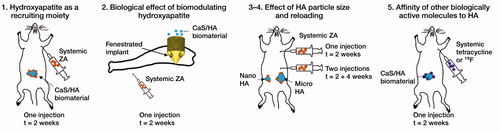
Figure 2. Uptake of 14C-ZA in the CaS/HA biomaterial placed in the abdominal muscle, 1 day post subcutaneous administration of 14C-ZA. Observe the difference in the scale of the y-axes for the 2 groups. Bars indicate uptake of 14C-ZA in the muscle (brown) and CaS/HA biomaterial (blue).
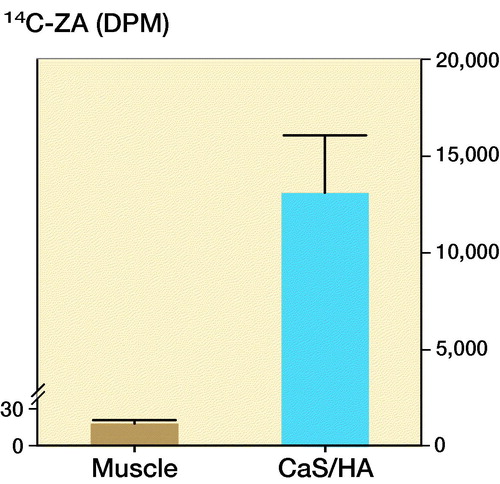
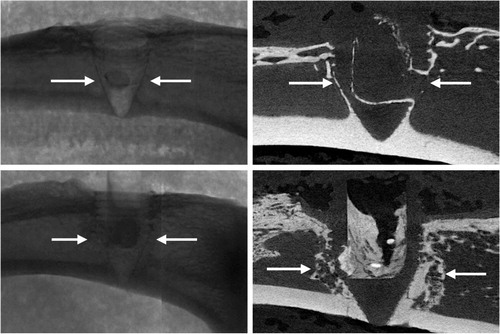
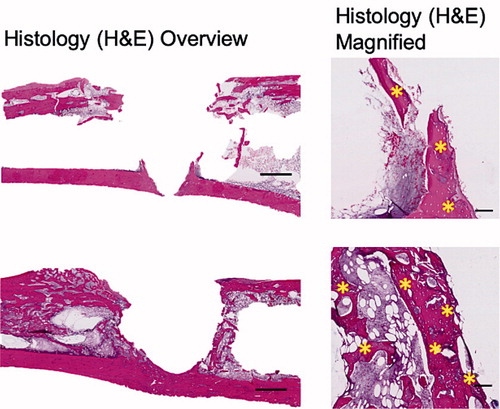
Figure 4. Timeline and uptake kinetics of 14C-ZA in micro- and nano-sized HA particles placed in the abdominal muscle pouch. Left: Uptake of 14C-ZA in the animals injected with 14C-ZA on day 13 and killed on day 14. Middle: Uptake of 14C-ZA in the animals injected with 14C-ZA on day 13 and killed on day 28. Right: Uptake of 14C-ZA in the animals injected with 14C-ZA on day 13 and day 27 and killed on day 28. Each line on the graph presents paired data from the same animal. Statistical analysis was performed using Wilcoxon’s matched pairs signed rank test.
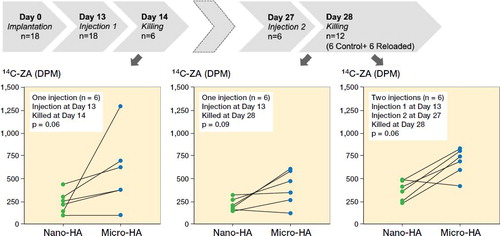
Figure 5. Reloading efficiency of HA particles with 14C-ZA. Nano- (left) and micro-sized (right) HA particles injected with 14C-ZA and its uptake after 1 or 2 subcutaneous injections of 14C-ZA. a indicates p < 0.05 (Mann–Whitney U-test).
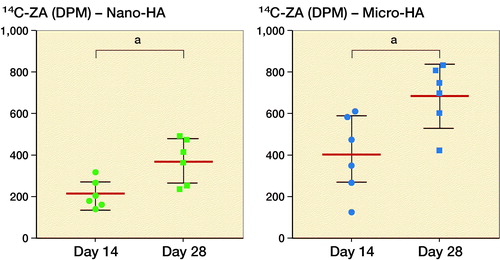
Figure 6. Uptake of tetracycline (administered systemically) in a pellet of CaS/HA biomaterial placed in the abdominal muscle pouch of rats, 24 h post-administration detected using fluorescence microscopy. Yellow box (top, right) indicates the approximate region where the high magnification (bottom, right) fluorescence image was captured. Low magnification image was captured with an exposure of 1 s while the high magnification image was captured with an exposure of 200 ms.
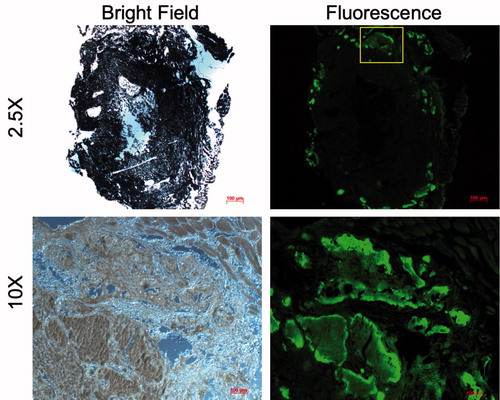
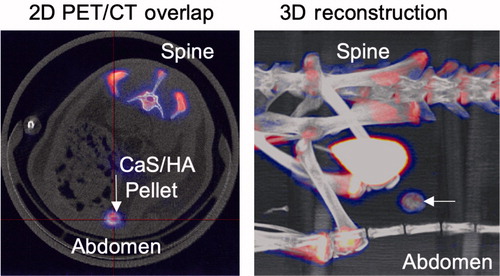
Figure 7. Uptake of 18F (administered systemically) in a pellet of CaS/HA biomaterial placed in the abdominal muscle pouch of rats, 1 h post-administration detected using PET-CT.