
Figures & data
Figure 1. Case selection for inclusion in this study.
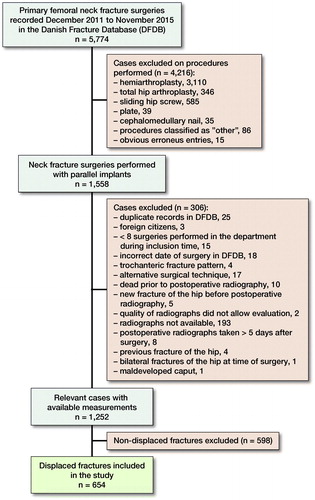
Figure 2. Degree of fracture displacement. The fractures were divided into 2 groups: “Mildly displaced” fractures: Garden type II fractures (A) with ≥ 20° posterior tilt measured on the axial view (B), Garden type III fractures (C), and “Severely displaced” fractures: Garden type IV fractures (D).
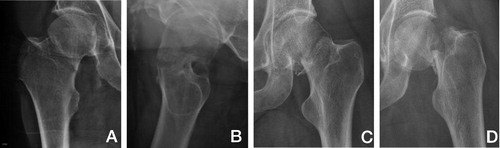
Figure 3. Cortical thickness index (CTI) is thickness of the cortices (white line minus black line) in relation to the diameter of the bone (white line) 10 cm below the tip of trochanter minor (grey vertical line). CTI = (white line – black line)/white line.
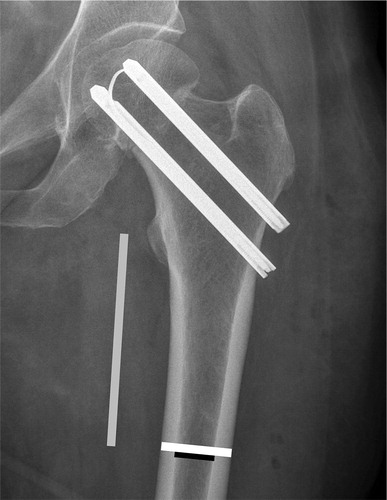
Table 3. Cox regression analysis of risk of reoperation
Table 2. Demographics and measurements of included cases. Values are frequency (%)
Table 4. Cox regression analysis of risk of death
Table 5. Estimates of risk of reoperation and death for predefined cases 1 year postoperatively. Values are percentages