
Figures & data
Figure 1. Flowchart.
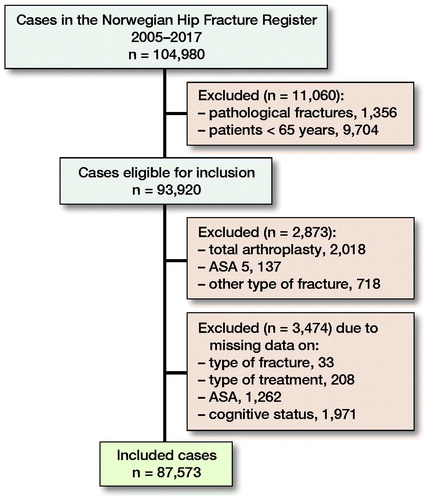
Table 1. Baseline data for patients by cognitive function. Values are frequency (%) unless otherwise specified
Table 2. Number of reoperations and risk of reoperation after hip fracture surgery by cognitive function using Cox regression model and Fine and Gray model with adjustments for age, sex, ASA classification, fracture type, and treatment
Table 3. Reasons for reoperation after hemiarthroplasty and osteosynthesis. Reoperations appear in the order of our hierarchy. Values are frequency (%)
Supplemental material