
Figures & data
Table 1. Demographic distribution for included variables. Values are frequency (%)
Figure 1. Graph showing the proportion of children with scoliosis correctly predicted to develop scoliosis before the age of 16 years (the sensitivity) and the proportion of children without scoliosis correctly predicted not to develop scoliosis before the age of 16 years (the specificity) for choice of a cutoff to indicate a high-risk individual.
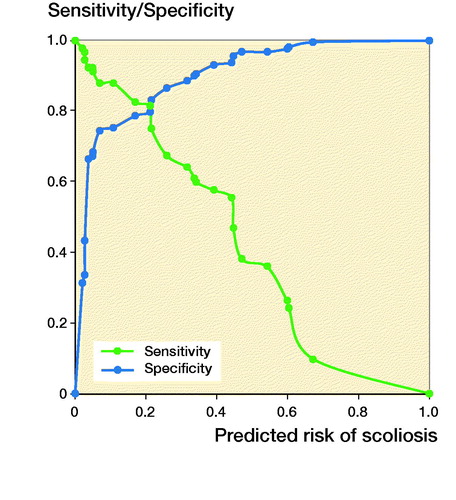
Table 2. Odds ratios (OR) with 95% confidence intervals (CI) for possible predictors of scoliosis measured at the age of 5 (steps 1 and 2) a
Table 3. Risk of developing scoliosis before the age of 16, corresponding to each risk score level