
Figures & data
Figure 1. CONSORT flow diagram showing the inclusion/exclusion process until 2-year follow-up.
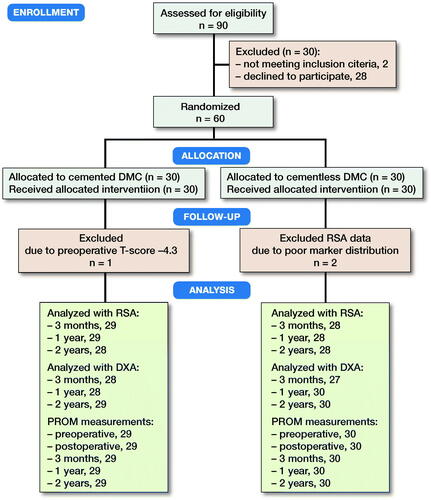
Table 1. RSA measurement error based on double-examination stereoradiographs
Figure 2. Illustration of directions, translation, and rotations for Avantage DM cup.
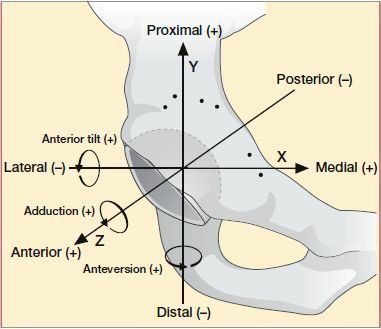
Figure 3. Wilkinson regions of interest (ROI) 1–4. Only the bone areas within yellow lines are included in the analysis.
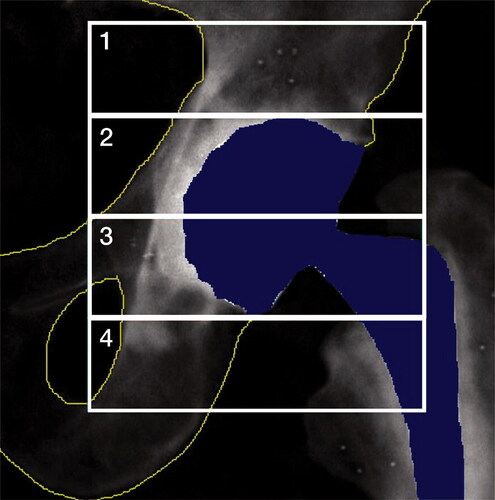
Table 2. DXA (g/cm2) measurement error based on 3-month double-examination DXA scans for cemented and cementless cup fixation
Table 3. Descriptive baseline characteristics of the patients, implants, and surgery. Values are mean (range) unless otherwise specified
Figure 4. Significant migration in cementless cups compared with cemented in y-axis, TR, and MTPM.
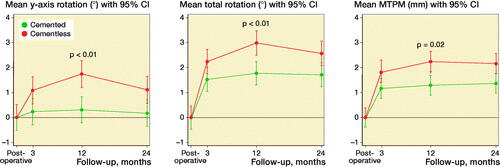
Table 4. Translations along and rotations about the x-, y-, and z-axis for cemented and cementless cups presented as mean (95% CI)
Table 5. Cup rotations and MTPM between follow-ups within each cup fixation group presented as mean difference (95% CI)
Figure 5. Proximal translation in normal and low BMD when stratified according to fixation method.
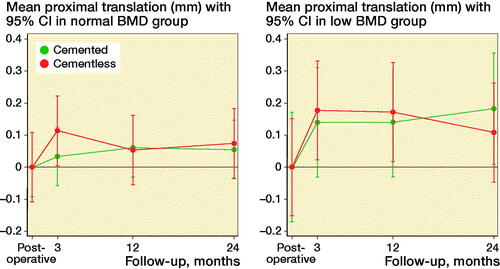
Figure 6. MTPM migration in normal and low BMD groups based on cup fixation.
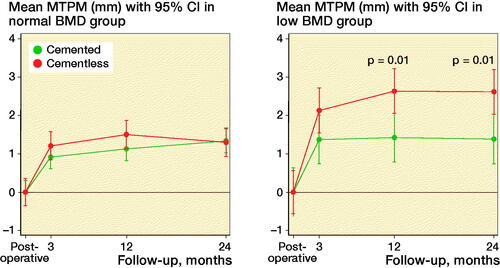
Table 6. BMD change in the 4 ROIs around the acetabular component presented as mean (95% CI) percentage change from the baseline values at 3, 12, and 24 months
Table 7. Mean (SD) scores for the HHS, OHS, EQ-5D, and VAS for pain