Figures & data
Figure 1. Preoperative and 1-year postoperative procedures for collecting the EQ-5D-3L and -5L questionnaires. aNon-respondents were reminded after 1 month according to regular procedure.
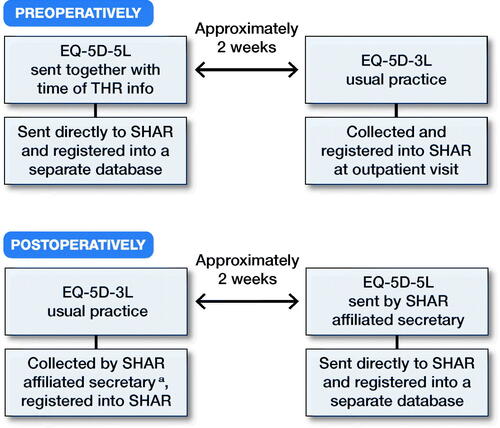
Figure 2. Possible redistribution of responses between EQ-5D-3L and -5L. Inconsistency = choosing an answer 2 levels from the first.
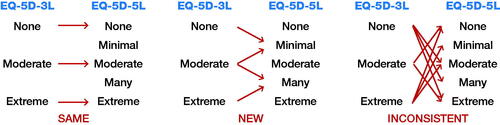
Table 1. Demographics pre- and 1 year postoperatively THR
Table 3. Percentage of patients reporting severe problems (floor effect) and no problems (ceiling effect)
Figure 3. Redistributions of answers between EQ-5D-3L and -5L for all patients.
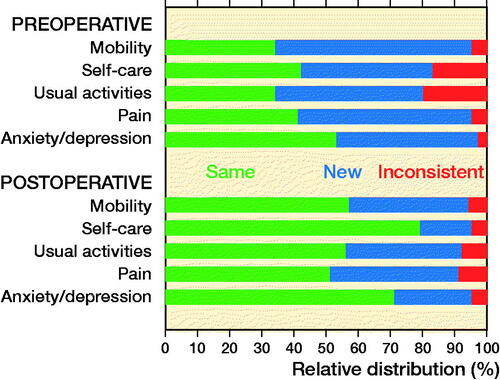
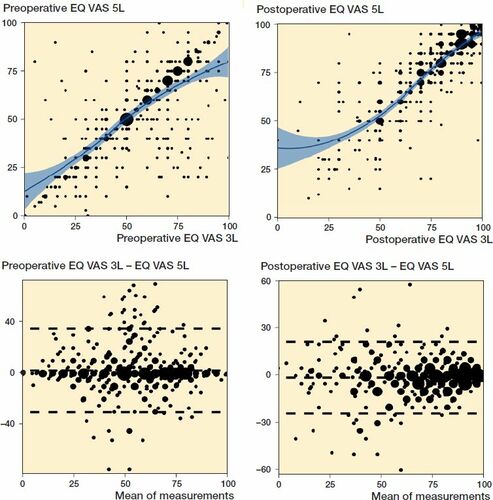
Figure 4. Strength of association and agreement between the EQ VAS scores obtained with the EQ-5D-3L and -5L questionnaires approximately 2 weeks apart. The diameter of the points is proportional to the number of patients reporting that particular score. Note the different scaling of the y-axis in the Bland–Altman plots to improve visibility.