
Figures & data
Figure 1. Postoperative images. Note the greater density in the bone graft compared with native bone. The 3 red circles indicate the ROIs of the bone mineral density measurements.
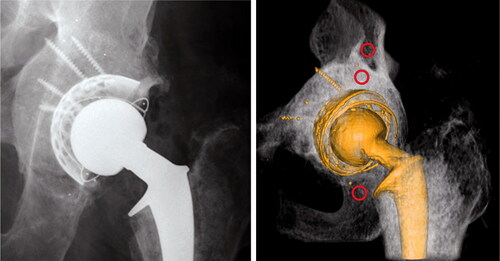
Figure 2. 3-D rendering of bone graft volume.
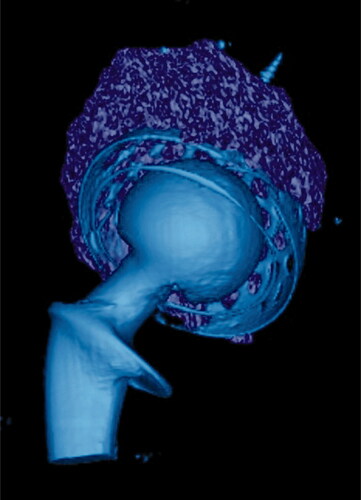
Table 2. Postoperative measurements of bone mineral density in the ROIs. Values are mean (mg/cm³) with 95% confidence intervals
Table 1. Postoperative translations of the acetabular component. Values are mean (mm) with 95% confidence intervals