
Figures & data
Figure 1. Measurement of the Hip–knee–ankle angle on full limb radiograph. The hip–knee–ankle angle (HKAA, in green) is measured between 2 axes (in red). One axis runs from the middle of the femoral head to the middle of the femoral notch, and a second axis from the middle of the tibial notch to the middle of the talar head.
Definitions of the femoral axis from left to right (top):
Fem1—mid-shaft at approximately 10 cm proximal of the femoral notch + mid-shaft in the area where the meta- and epiphysis meet (van Raaij et al. Citation2009, Iranpour-Boroujeni et al. Citation2014, Zampogna et al. Citation2015).
Fem2—mid-shaft at approximately 10 cm proximal of the femoral notch + center of the femoral notch (Felson et al. Citation2009, van Raaij et al. Citation2009, McDaniel et al. Citation2010, Sheehy et al. Citation2011).
Fem3—mid-shaft at approximately 10 cm proximal of the femoral notch + base of the tibial spines (Kraus et al. Citation2005, Hinman et al. Citation2006, Issa et al. Citation2007, McDaniel et al. Citation2010, Navali et al. Citation2012, Iranpour-Boroujeni et al. Citation2014, Zampogna et al. Citation2015).
Fem4—mid-shaft at approximately 10 cm proximal of the femoral notch + middle of tibial plateau (McDaniel et al. Citation2010).
Definitions of the tibial axis from left to right (bottom):
Tib1—mid-shaft at approximately 10 cm distal of the base of the tibial spines + mid-shaft in the area where the meta- and epiphysis meet (van Raaij et al. Citation2009, Iranpour-Boroujeni et al. Citation2014, Zampogna et al. Citation2015).
Tib2 Mid-shaft at approximately 10 cm distal of the base of the tibial spines + center of the femoral notch (McDaniel et al. Citation2010).
Tib3—mid-shaft at approximately 10 cm distal of the base of the tibial spines + base of the tibial spines (Kraus et al. Citation2005, Hinman et al. Citation2006, Issa et al. Citation2007, Colebatch et al. Citation2009, van Raaij et al. Citation2009, McDaniel et al. Citation2010, Sheehy et al. Citation2011, Navali et al. Citation2012, Iranpour-Boroujeni et al. Citation2014, Zampogna et al. Citation2015).
Tib4—mid-shaft at approximately 10 cm distal of the base of the tibial spines + middle of tibial plateau (McDaniel et al. Citation2010).
The 2 pictures on the left show the measurement of the FTA using method 2 for the femoral axis and method 1 for the tibial axis on a standard AP knee radiograph from the present data set.
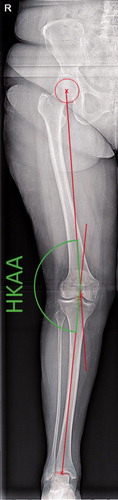
Figure 2. Measurement of the femoro-tibial angle (FTA) on standard knee radiographs.
Tib4
Fem4
Tib3
Fem3
Tib2
Fem2
Tib1
Fem1
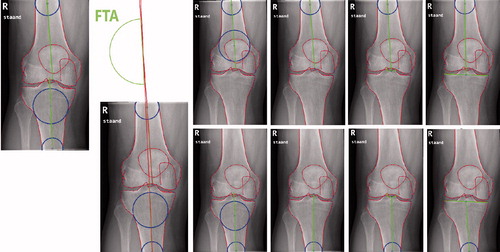
Table 1. Correlations between femoro-tibial angle and hip–knee–ankle angle as reported in the literature
Table 2. Pearson correlation coefficients and intra-class correlations (ICC) between FTA and HKAA measurements (across all pairs of images)
Figure 3. Bland–Altman plot depicting the error between the observed HKAA (gold standard) and the predicted HKAA in the cross-validation setting. Negative numbers represent the degree of varus alignment and positive numbers represent the degree of valgus alignment. The solid line depicts the mean error and the dotted lines the 95% confidence interval.
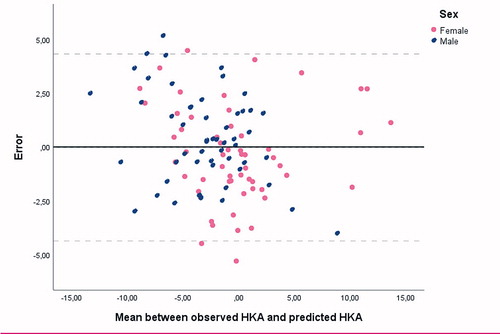
Table 3. Pearson correlation coefficients and intra-class correlations (ICC) between FTA and HKAA measurements (cross-validation experiments)