Figures & data
Figure 1. A Continuum cup (A) and a control group cup (B).
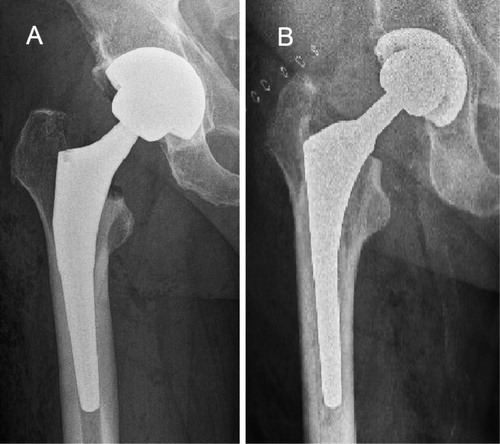
Table 1. Demographic and surgical data of study population. Values are number (%) unless otherwise specified
Table 2. Median cup angles and percentages of cups in the Lewinnek safe zone in the Continuum cup study group and the other uncemented cups control group
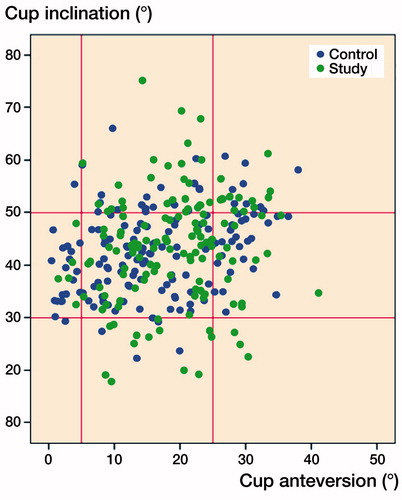
Figure 2. The scatter plot depicts Martell radiographic analysis, which compares the distribution of 2 groups in the safe zone.