Figures & data
Figure 1. Flow chart showing eligibility, exclusion, enrolment and loss to follow-up of patients.
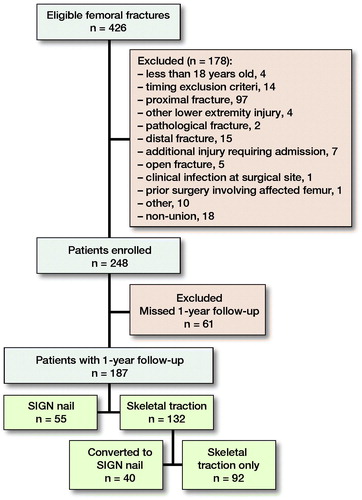
Table 1. Baseline details
Figure 2. Unadjusted mean EQ-5D scores for IM nailing vs. skeletal traction.
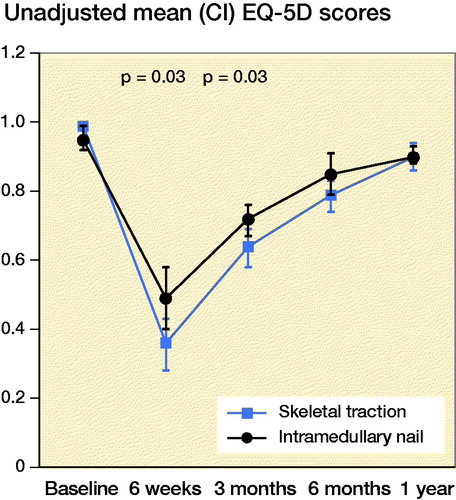
Table 2. Unadjusted results for sub-group analysis. Values are mean (CI)
Table 3. Adjusted results
Figure 3. Unadjusted mean SMFA Functional Index scores for IM nailing vs. skeletal traction.
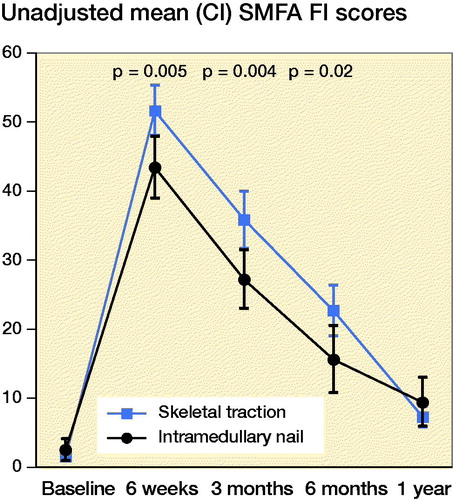
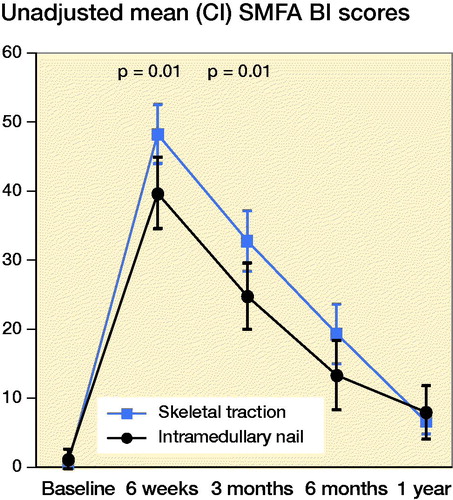
Figure 4. Unadjusted mean SMFA Bothersome Index for IM nailing vs. skeletal traction.