
Figures & data
Figure 1. The stems: on the left the Bi-Metric stem and on the right the Echo Bi-Metric stem.
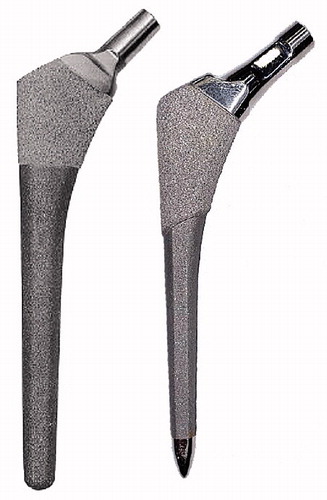
Figure 2. (A) The RSA coordinate system with movements; (B) model-based RSA screenshot while using the RSAcore software.
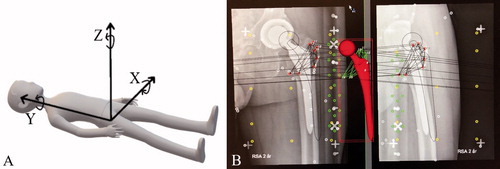
Figure 3. Flowchart
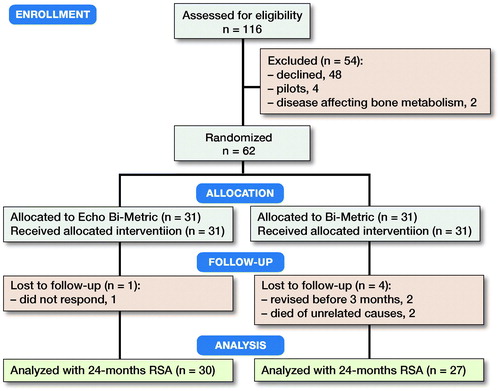
Table 1. Baseline demographics. Values are mean (range) unless otherwise specified
Figure 4. Mean Y-translation at each follow-up for the 2 stems (bars are standard error of mean).
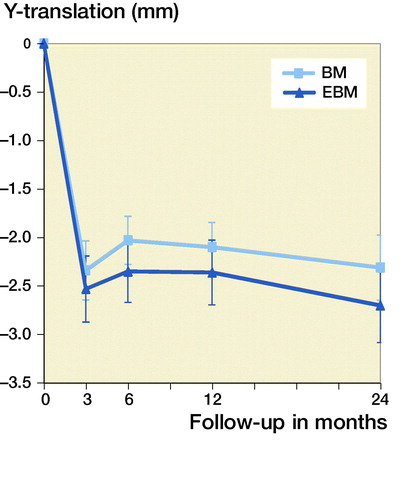
Table 2. Mean segment motion (95% CI) of the Bi-Metric (BM) and the Echo Bi-Metric (EBM) stems at follow-up until 24 months. Outliers are included in the analysis
Figure 5. Mean Y-rotation at each follow-up for the 2 stems (bars are standard error of mean).
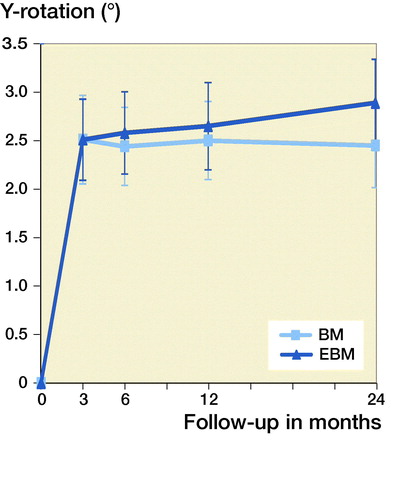
Table 3. Y-rotation (°) outliers and and their 24-month clinical score
Table 4. Clinical outcome. Values are mean (range)