
Figures & data
Figure 1. CONSORT flowchart of the trial enrollment and analysis.
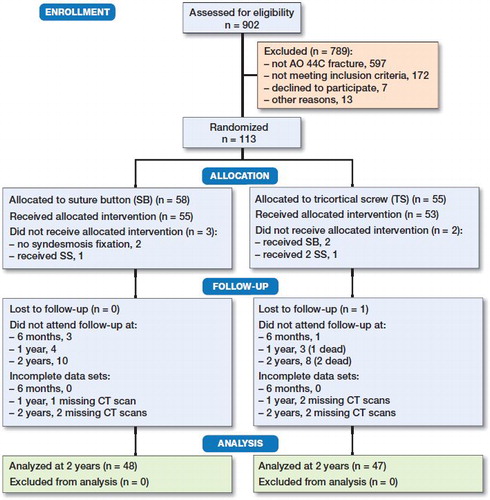
Figure 2. CT of injured ankle (upper panel) and uninjured ankle (lower panel) in a 20-year-old woman, 2 years after injury. Tibiofibular distance is measured on axial CT 1 cm proximal to the ankle joint. Distance measured anterior (A); central (C); and posterior (P).
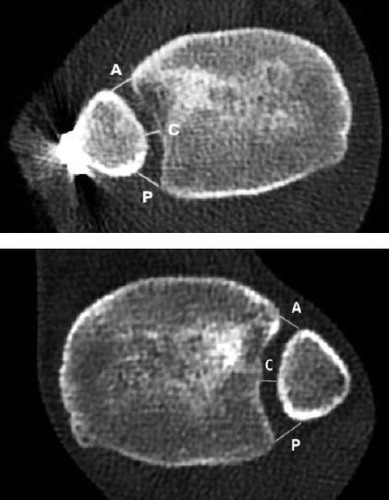
Table 1. Patient characteristics at time of enrolment. Values are number of patients unless otherwise specified
Figure 3. AOFAS equivalence diagram. Blue area indicates margins of equivalence defined as the between-group difference of 10 points. Results at all time intervals are equivalent since the 95% CI lies wholly inside the margins.
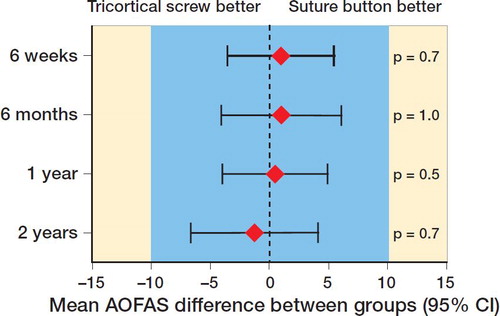
Table 2. Primary and secondary outcome measures
Table 5. Radiological results: difference measured in mm in tibiofibular distance at level of syndesmosis (1 cm proximal to the ankle joint) between injured and uninjured side. Values are mean (SD) or median (IQR) unless otherwise specified