Figures & data
Figure 1. Respondent flowchart. a Percentage of total number of respondents.
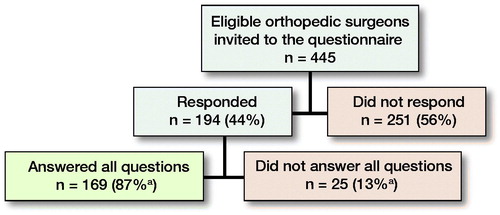
Table 1. Characteristics of the respondents (n = 194). Values are frequency (%)
Table 2. Associations between awareness of surgeon-group performance and logging in to dashboard, correct funnel-plot interpretation, and knowledge of 1-year revision rate
Table 3. Composite outcome, stratified by hospital setting and number of arthroplasties performed annually
Figure 2. Currently available performance indicators on the secure LROI dashboard ranked from most to least interesting by respondents. LROI = Netherlands Registry of Orthopedic Implants; PROMs = patient-reported outcome measures.
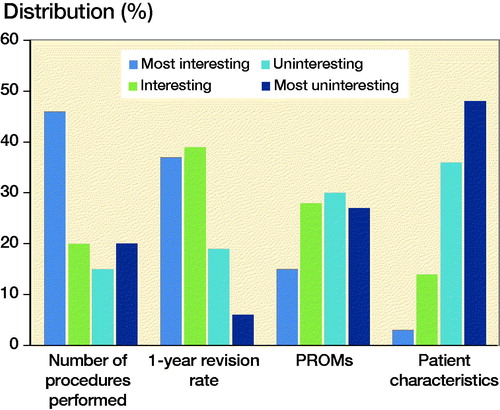
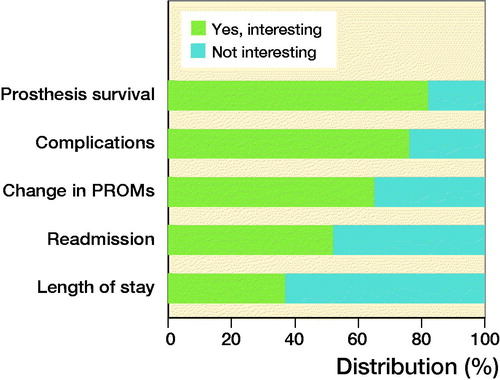
Figure 3. Percentage of orthopedic surgeons interested in additional performance indicators. Change = difference between pre- and postoperative PROMs. For abbreviations, see