
Figures & data
Figure 1. Flowchart of patients included in the study.
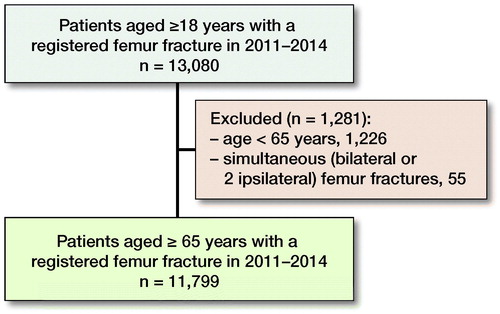
Table 1. Baseline demographic characteristics of the study population of 11,799 patients with femoral fractures. Values are distribution of the Charlson Comorbidity Index category and subcategories (%) depending on fracture segment
Figure 2. Unadjusted cumulative mortality up to 1 year after index fracture per femoral segment with 95% confidence intervals.
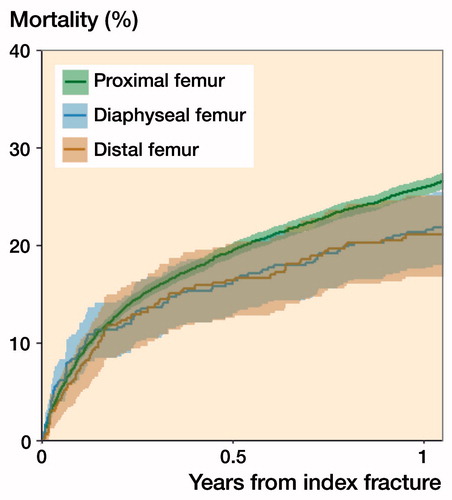
Table 2. Unadjusted 90-day mortality dependent on fracture location and adjusted for age, sex, and the Charlson Comorbidity Index (CCI), including stratified analyses for sex and CCI groups. Values are percentage and relative risks (RR) with 95% confidence intervals (CI)
Table 3. Unadjusted 30- and 365-day mortality dependent on fracture location. Values are mean percentage (95% CI)