
Figures & data
Figure 1. Study population. THA – total hip arthroplasty, TKA – total knee arthroplasty.
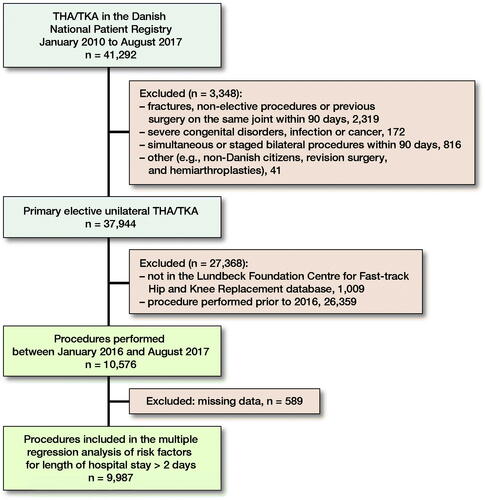
Table 1. Patient characteristics Values are count (%) unless otherwise specified
Figure 2. Distribution of procedures and day of discharge according to weekday. There were 11 (0.1%) procedures on Saturday and Sunday, all in patients with < 6 points.
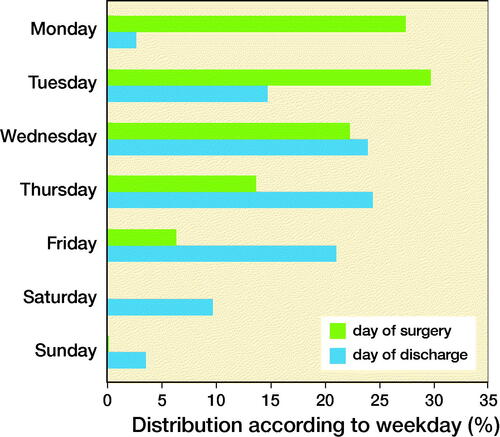
Table 2. Multiple-regression analysis of risk factors (n = 9,987) for LOS > 2 days and attributed risk-score points
Figure 3. Distribution of patients with length of stay (LOS) > 2 days and < 3 days according to number of points based on odds ratios of relevant risk factors for LOS > 2 days.
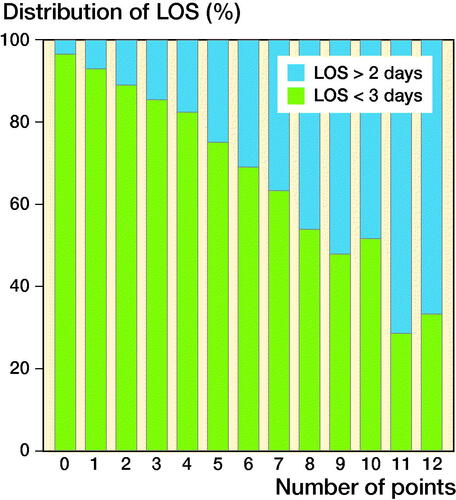
Figure 4. Distribution of procedures on each weekday according to number of points for LOS > 2 days.
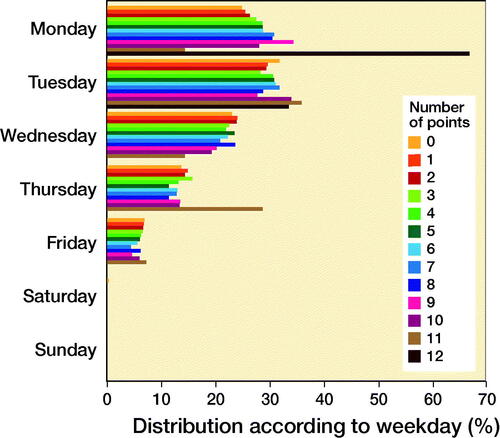
Table 3. Distribution of points depending on number of risk factors for LOS > 2 days