Figures & data
Figure 1. Relationship between year of primary surgery and risk of revision due to deep infection (with 95% confidence interval) for all THAs, adjusted for sex, age, ASA class, indication for primary THA, duration of surgery, surgical approach, and modularity of the THA. The broken line represents the HRR in 2005 (HRR = 1).
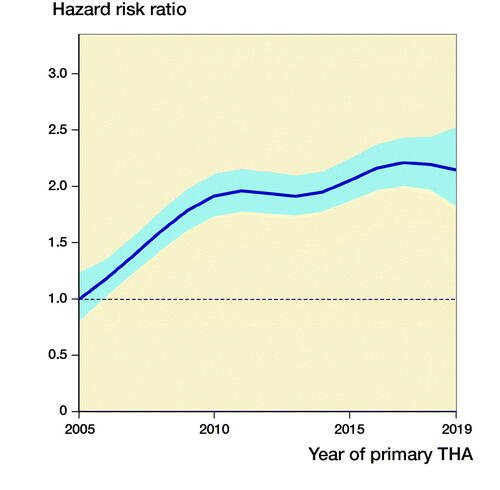
Figure 2. Curves of adjusted revision-percentage due to deep infection, for all THAs, for cemented THAs, uncemented THAs, reverse hybrid THAs, and hybrid THAs, for 3 periods of primary surgery, adjusted for sex, age, ASA class, indication for primary THA, duration of surgery, surgical approach, and modularity of the THA.
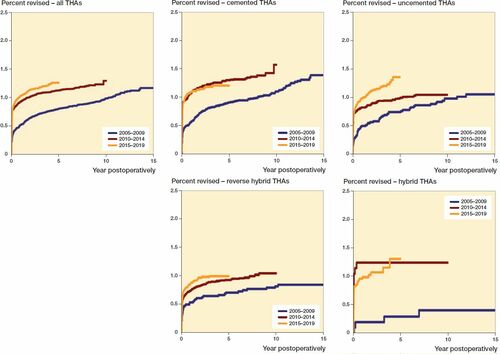
Table 1. Absolute annual number of primary THAs and revisions due to infection for the period 2005–2019
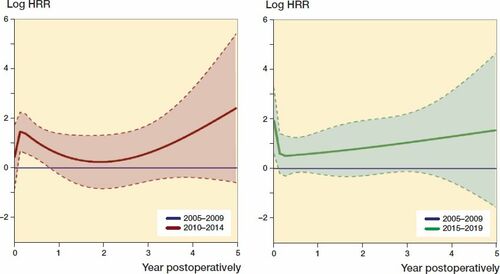
Figure 3. The relationship between HRR of revision due to infection and timespan postoperatively after primary THAs for the period 2010–2014 (red line) and 2015–2019 (green line) compared with 2005–2009 (blue lines). Smoothed Schoenfeld residuals adjusted for sex, age, ASA class, indication for primary THA, duration of surgery, surgical approach, and modularity of the THA (solid lines) with 95% confidence intervals (broken lines).