Figures & data
Figure 1. The study cohort recruitment process.
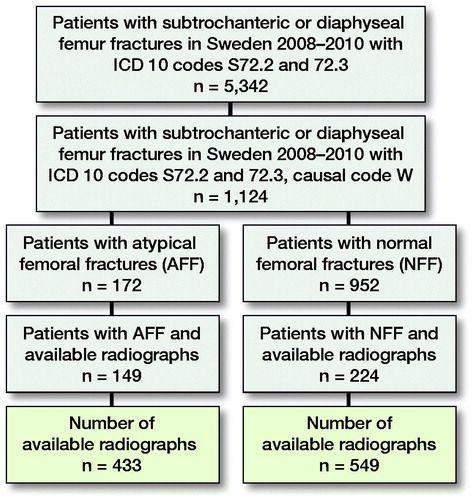
Figure 2. The intervention pathway involves reposition (A), rotation (B), and cropping (C).
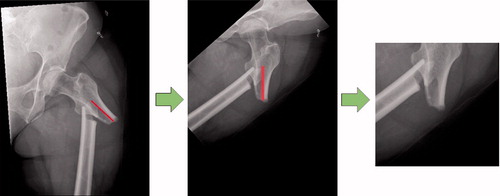
Figure 3. Accuracy plots for: (A) VGG19; (B) InceptionV3; and (C) ResNet50, as expressed for the automated method.
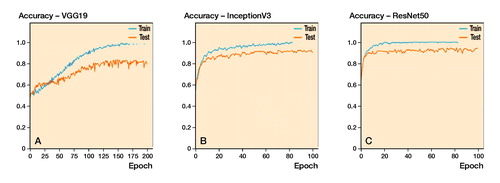
Figure 4. Receiver operating characteristics (ROC) curves for each network and the automated (upper row) and the intervention (lower row) pathway. The intervention pathway of the ResNet50 network shows the lowest rate of false positives at the highest rate of true positives yielding a mean AUC (area under the curve) of 0.94.
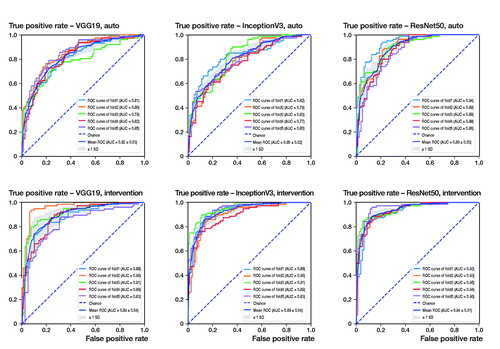
Table 1. Cross-validation of the automated method using VGG19, InceptionV3, and ResNet, expressed as percentages and averages with standard deviations (SD) for K-folds
Table 2. Cross-validation for intervention method (manual adjustment of alignment and rotation) using VGG19, InceptionV3, and ResNet expressed as percentages and averages (SD) for K-folds
Table 3. Comparison with Multi-Metrics depicting accuracy, sensitivity, specificity, and precision of discrimination between fracture types expressed as percentages (SD) for the automatedmethod and the intervention method for each network
Figure 5. Attention maps showing areas in the image that are utilized by the network for learning through class activation mapping. Fracture region of AFFs (atypical femoral fractures) (A + B) and NFFs (normal femur fractures) (C + D) are correctly depicted by the network. Focus outside the fracture region (E + F) might lead to misclassification.
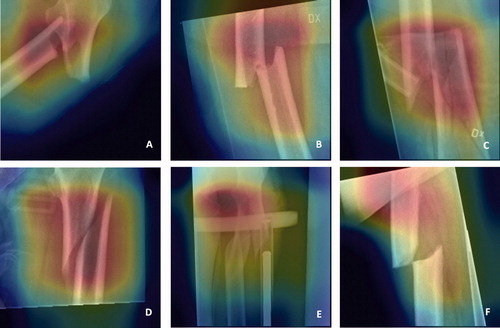
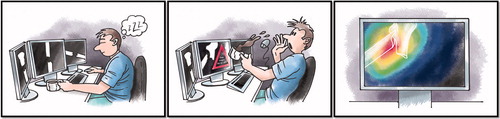
Figure 6. Artificial intelligence designed to attract attention to places where attention is needed. Illustrated by Pontus Andersson.