
Figures & data
Table 1. Patient demographics. Values are count (%) unless otherwise specified
Figure 1. Graph showing risk of prosthetic joint infection (PJI) according to PPI use (weighted 1-minus-survival Kaplan–Meier plot).
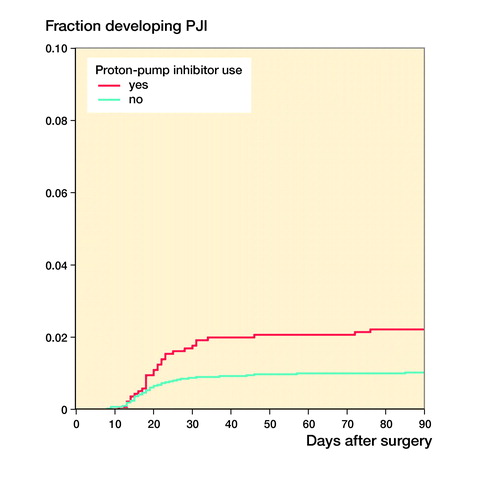
Table 2. Univariable weighted Cox proportion hazard regression model
Table 3. Multivariable weighted Cox proportion hazard regression model for PPI