
Figures & data
Figure 1. Compensation claims received by NPE from 1988 until 2020. White area represents the time period of the current study (2012–2018).
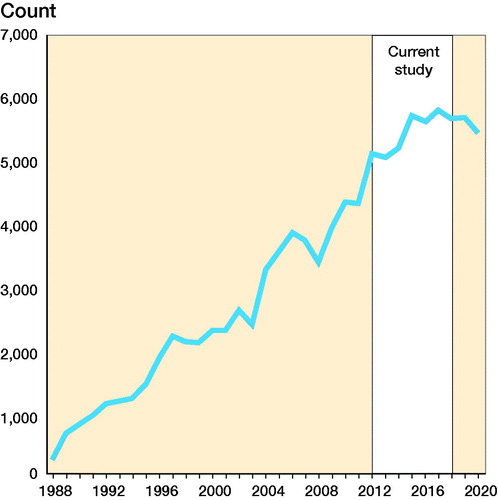
Table 1. Compensation claims received by NPE 2012–2018 according to the 5 most common medical subspecialties
Table 2. All claims listed in groups according to the ICD 10 classification system and number of claims granted. Values are count
Table 3. Most common specific diagnoses and information on the number of submitted and granted claims, and reason for granting in children aged 0–17 years. Values are count
Table 4. Incidence of claims granted in relation to extrapolated occurrence of pediatric fractures in children aged 0–15 years
Table 5. Incidence of claims for pediatric hip diseases in relation to data provided by the Norwegian National Pediatric Hip Registry