Figures & data
Table 1. Overall descriptive data
Table 2. Fractures in all locations, fractures in another location at the same time, and a new fracture within a year. Values are count (%)
Figure 1. 30-day (left) and 1-year (right) SMR in different body locations illustrated with color intensity, based on SMR figures. Cut-offs and SMR color codes are different for 30-day and 1-year SMR.
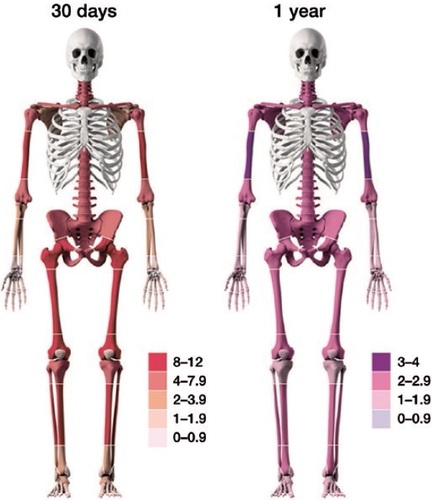
Table 3. 30-day and 1-year mortality rate in patients sustaining a fracture at any location
Table 4. Mortality rates at 30 days and 1 year for patients sustaining shoulder and upper extremity fractures
Table 5. Mortality rates at 30 days and 1 year for patients sustaining fractures in the lower extremities
Table 6. Mortality rates at 30 days and 1 year for patients sustaining spinal and pelvic fractures
Figure 2. 30-day mortality rate of all fractures for different ages (from 16 years), and sorted by sex in percentages (left). Normal population reference values included. 30-day SMR with 95% CI for all fractures for different ages (from 16 years) and sorted by sex (right). There were no observed deaths within 30 days for individuals below 24 years.
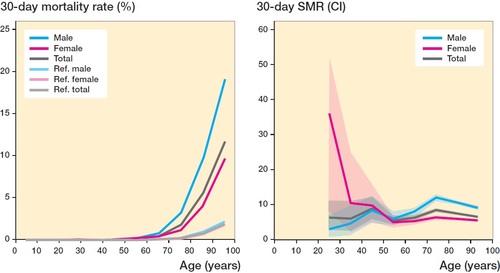
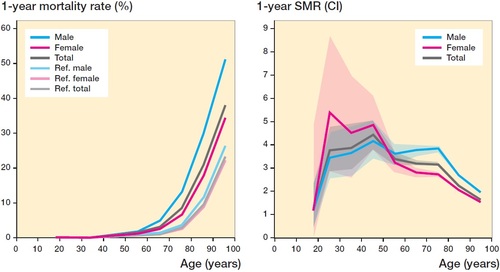
Figure 3. 1-year mortality rate for all fractures for different ages (from 16 years) and sorted by sex in percentages (left). Normal population reference values included. 1-year SMR with 95% CI for all fractures for different ages (from 16 years) and sorted by sex (right).