
Figures & data
Table 1. Characteristics of the population. Values are count (%)
Figure 1. 90-day survival analysis for THA patients (exposed, n = 4,043) and controls (unexposed, n = 19,388).
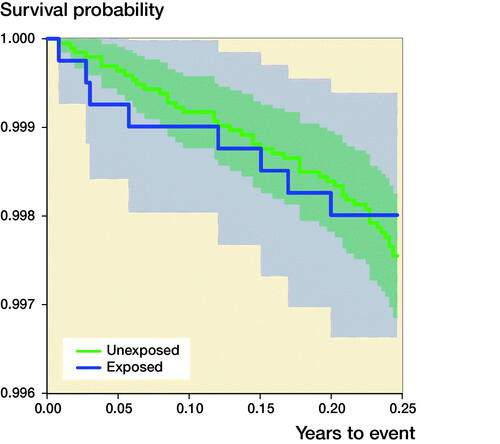
Table 2. Overall mortality, adjusted for confounders (CCI, income, and education) and for matching variables (age group, sex, and place of residence)
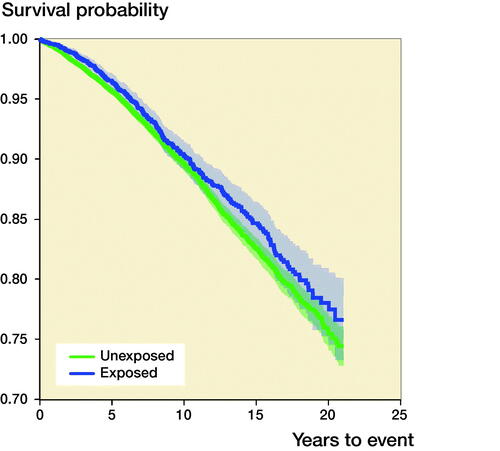
Figure 2. Overall survival analysis for THA patients (exposed, n = 4,043) and controls (unexposed, n = 19,388).
Supplemental material