
Figures & data
Flow chart displaying the included OA cohort and matched reference cohort. Adapted with permission from Gustafsson et al. (Citation11)
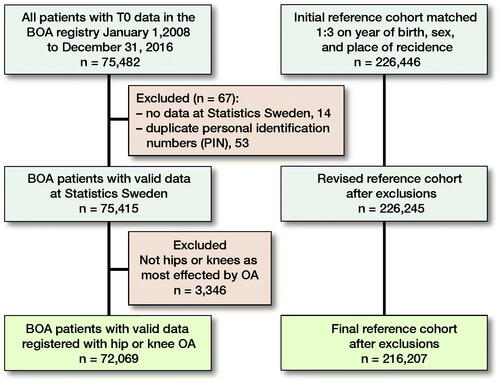
Table 2. OA cohort and reference cohort characteristics. Values are count (%) unless otherwise specified
Table 3. Comparisons of proportion and type of dispensed analgesic prescriptions in Sweden received by patients before commencing non-pharmacological primary care interventions for osteoarthritis (OA, n = 72,069) compared a general population cohort (Ref. n = 216,207)
Table 4. Comparisons of the proportion of dispensed analgesic prescriptions in terms of clinical guideline recommendations before (01/01/2008-31/05/2012) compared to after (01/06/2012-31/12/2016) guideline publication
Supplemental material