Figures & data
Figure 1. The regions (zones) used in the analysis of cup and stem interfaces (AP and lateral projections).
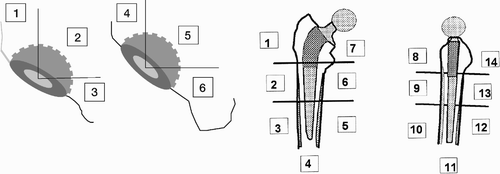
Figure 2. Radiostereometric examination in supine and standing position.
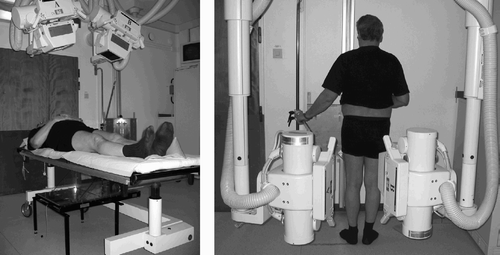
Figure 3. Schematic drawing of the cage showing the positions of the cage markets.
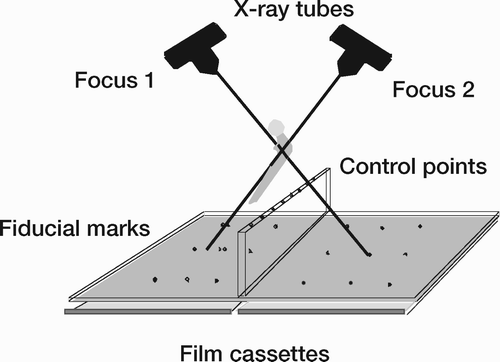
Figure 4. Mathematical models of tantalum markets used in the measurement procedure.
Table 1. Nomenclature of UHMWPE resins
Figure 5. Ram extrusion process.
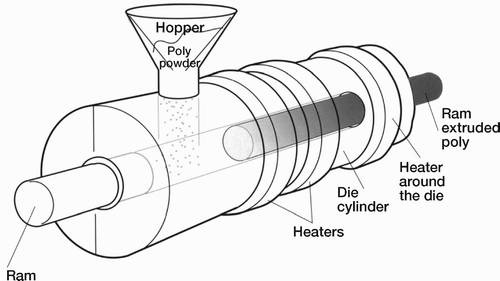
Figure 6. Compression moulded process.
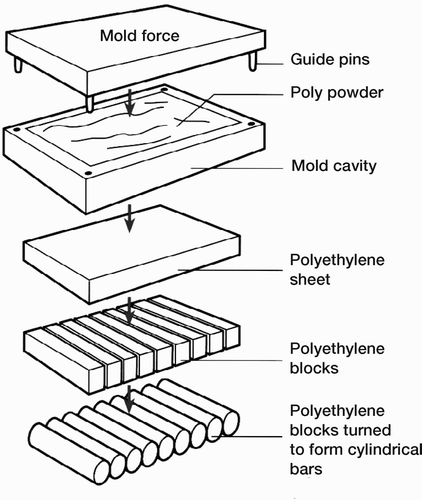
Figure 7. Oxidation of polyethylene.

Figure 8. Formation of cross-linked molecule.
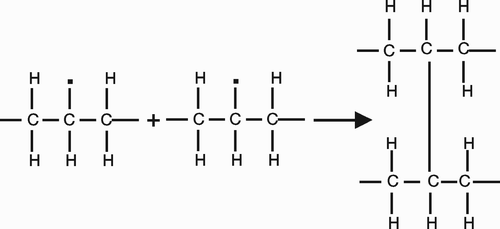
Table 2. Currently available highly crosslink polyethylene liners
Table 3. Composition of commercial bone cements
Figure 9. Acetabular implants from left to right. Reflection, all-poly (Smith & Nephew, USA), Lubinus, eccentric (Waldemar Link, Germany), Reflection, ± HA, ± screws or pegs (Smith & Nephew, USA), and Trilogy with 70% HA and 30% TCP ± screws (Zimmer Inc., Warsaw, USA).
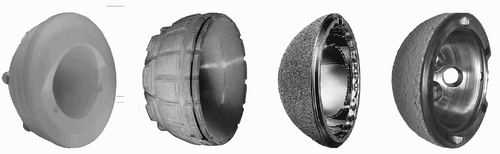
Table 4. Patient distribution in Paper I–V
Table 5. Study I: Demographic data and cup specifications
Table 6. Study I: Patient-related data for the uncemented pressfit Reflection group
Table 7. Study II: Demographic data
Table 8. Hybrid study (Study III): Demographic data
Table 9. Cemented study (Study III): Demographic data
Table 10. Study IV: Demographic data
Table 11. Study V: Demographic data
Table 12. Composition of the bone cements
Table 13. Different stems used in paper I
Figure 10. The Weber cup.
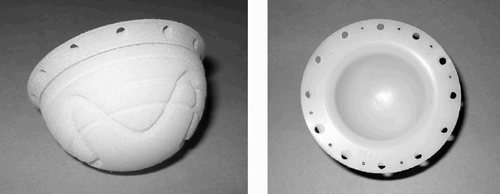
Figure 11. Classification of the cup in three equal parts on the frontal and lateral view.
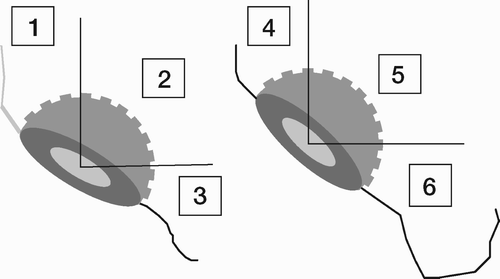
Table 14. Precision based on double examination
Table 15. Hips missing from RSA evaluation in each study
Figure 12. Lunar DPX-IQ densitometer.
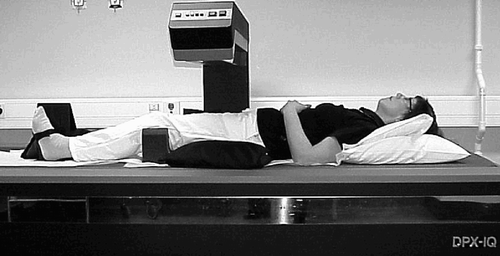
Figure 13. Classification of periprosthetic BMD on acetabular side in 5 ROIs.
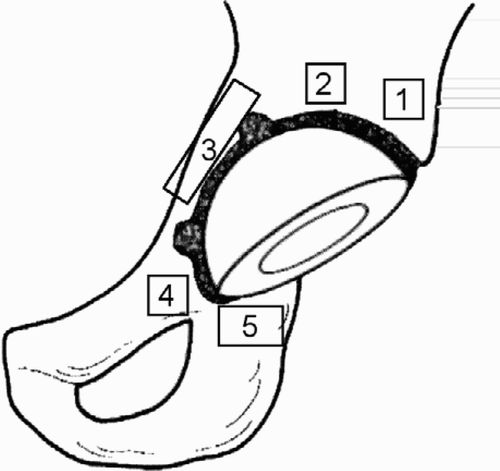
Figure 14. Classification of periprosthetic BMD on femoral side in 7 ROIs according to Gruen for automatic (left) and manual (right) DEXA analysis.
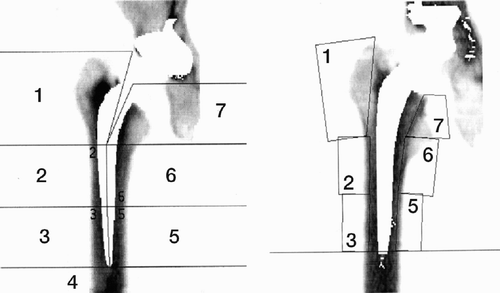
Figure 15. Proximal penetration of the femoral head. Mean (SEM).
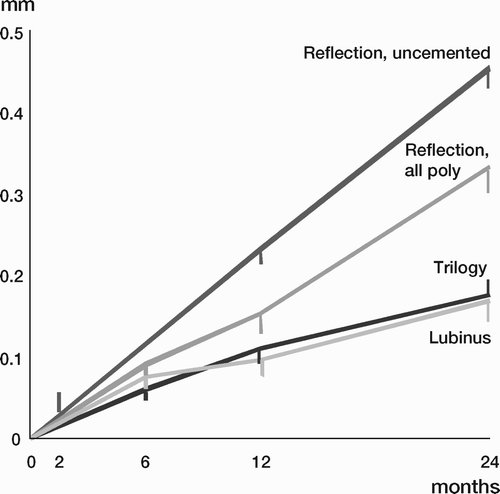
Figure 16. The total or three-dimensional vector length of femoral head penetration. Mean (SEM).
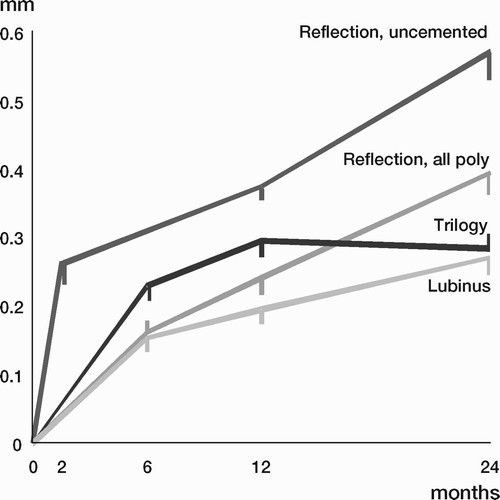
Table 16. Penetration at the 2-year follow-up (signed values, mm).
Figure 17. Proximal femoral head penetration in the supine position. Mean (SEM).
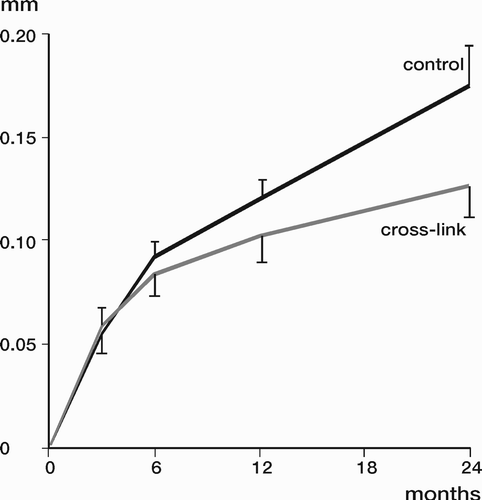
Figure 18. Proximal femoral head penetration in the standing position. Mean (SEM).
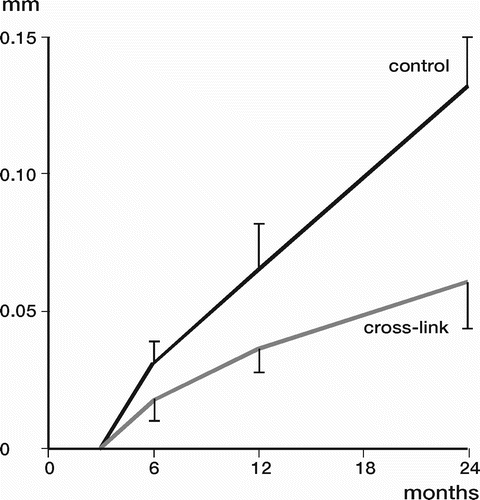
Table 17. Penetration between 3 and 24 months follow-up. The examination was performed with the patients standing.
Figure 19. The changes in percent of BMD between postoperative and 2 years examination for each ROI. Mean (SD), (p>0.09).
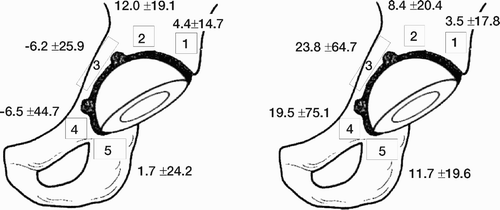
Figure 20. Proximal femoral head penetration in the supine position. Mean (SEM).
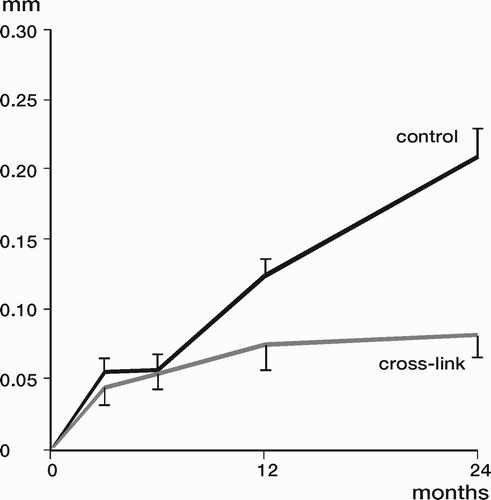
Figure 21. Three dimensional penetration in the supine position. Mean (SEM).
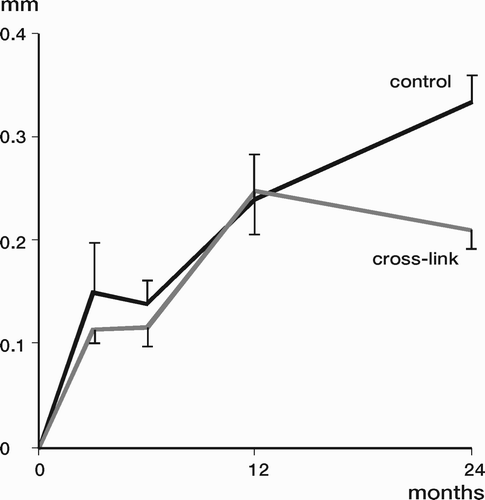
Table 18. Hybrid study, supine examinations 0–2 years
Figure 22. Proximal femoral head penetration in the supine position. Mean (SEM).
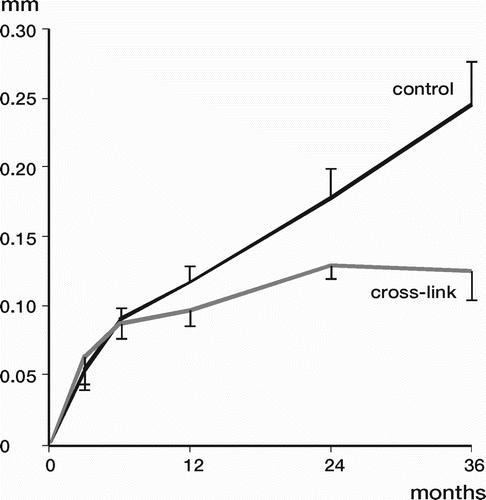
Table 19. Cemented study, supine examinations 0–3 years
Figure 23. Proximal femoral head penetration in the standing position. Mean (SEM).
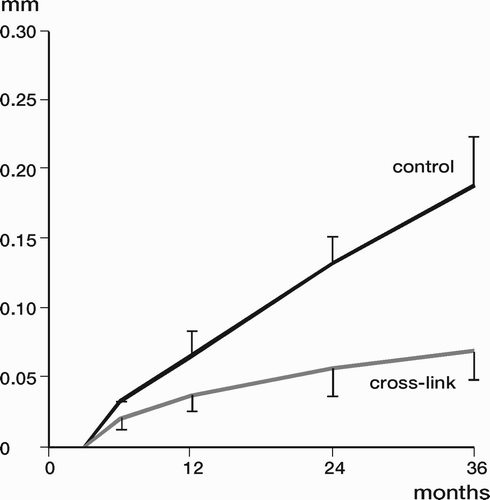
Figure 24. Subsidence between stem and bone in all cases. Mean (SEM).
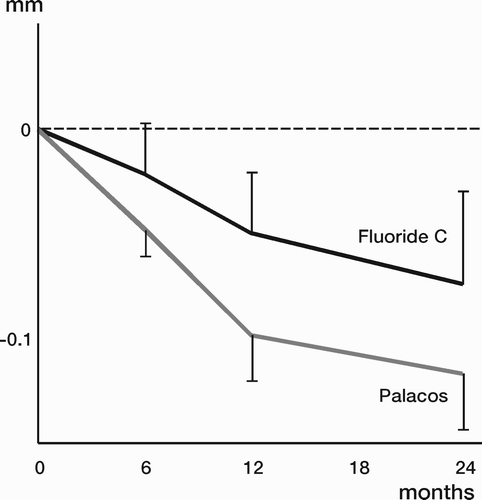
Table 20. Stem migration in relation to bone at the 2 years follow-up
Figure 25. Changes of BMD (%) postoperatively to 2 years. Automatic analysis. Median (range). P-values (right figure) refer to comparisons between the 2 groups.
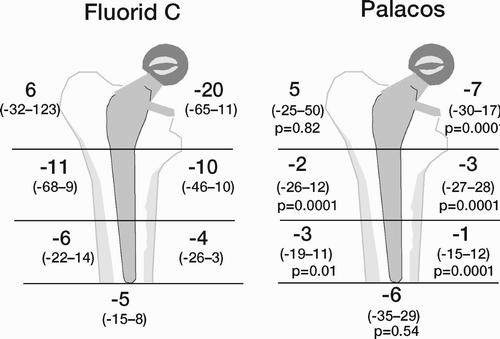
Figure 26. Changes of BMD (%) postoperatively to 2 years. Manual analysis. Median (range). P-value (right figures) refer to comparisons between the 2 groups.
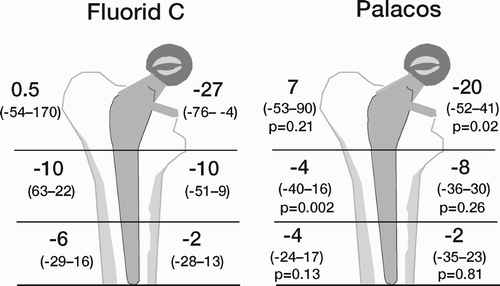
Figure 27. Proximal (+)/ distal(−) migration of the cup. Mean (SEM).
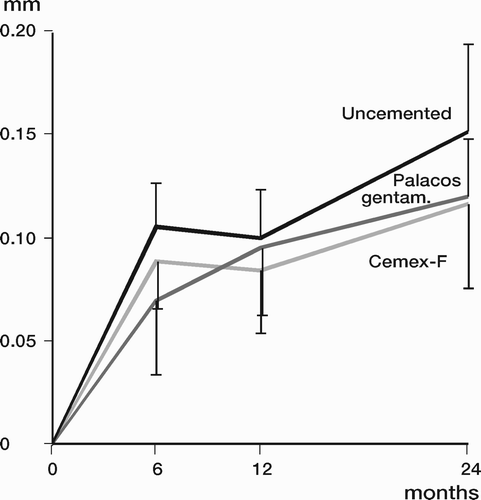
Table 21. Cup migration at 2 years follow-up. All hips
Figure 28. Migration of the socket in patients with and without osteoporosis at 2 years. Mean, 95% CI.
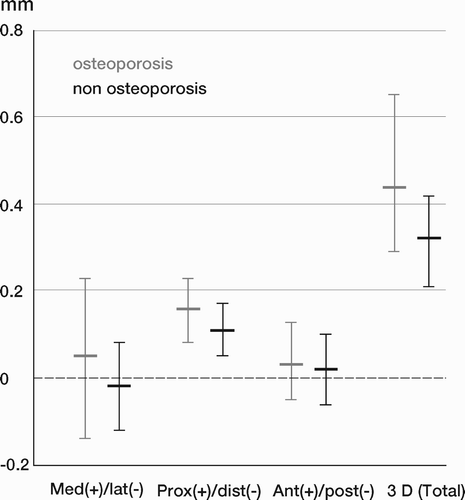
Figure 29. Three-dimensional (total) migration of the socket in each group of fixation at 2 years. Mean, 95% CI.
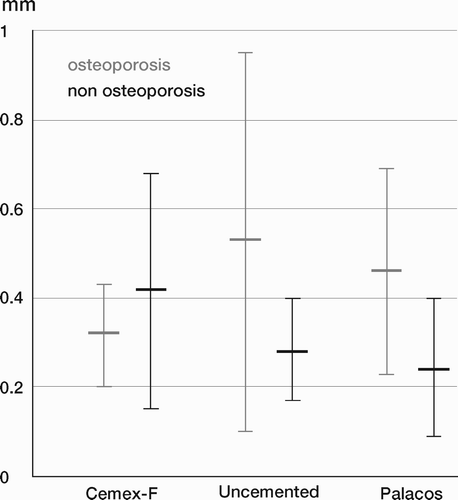
Table 1. Repeatability of the questionnaire in 20 patients
Table 2. Study IV: The maximum width (mm) of radiolucent lines in various Gruen regions postoperatively and at 2 years. Values are number, mean ± SE
Table 3. Study IV: Distribution of radiolucent lines (0 / 1–49 / 50–99 / 100%) in the various Gruen regions postoperative and at two years
Table 4. Study V: Maximum width of radiolucent lines in each region (mean ± SE)
Table 5. Study V: Distribution of radiolucent lines (0 / 1–49 / 50–99 / 100%) related to region (1-6).