Figures & data
Figure 1. Example patient’s mask from Case Series 1 (Injured/Traumatic Group)
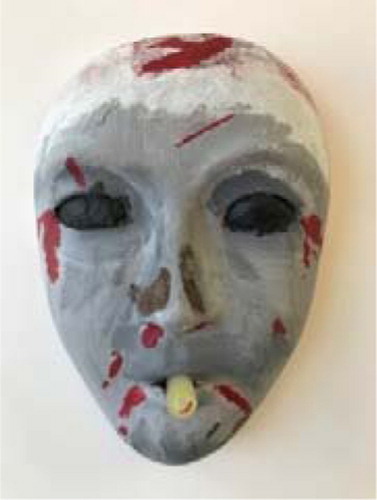
Figure 2. Example patient’s mask from Case Series 2 (Patriotic Group)
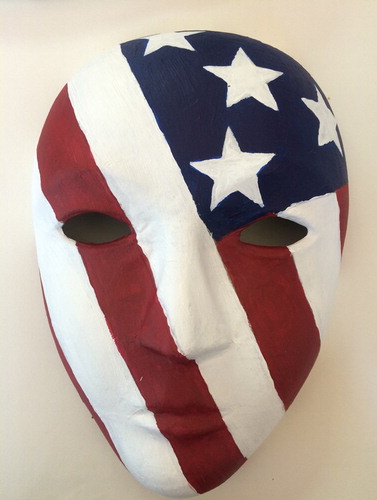
Figure 3. Resting state default mode network regions and corresponding average z-score connectivity values with 1 standard deviation from the mean. Results from Mann-Whitney U-tests at p < 0.05 denoted by *. (Group 1 = injured/traumatic, Group 2 = patriotic).
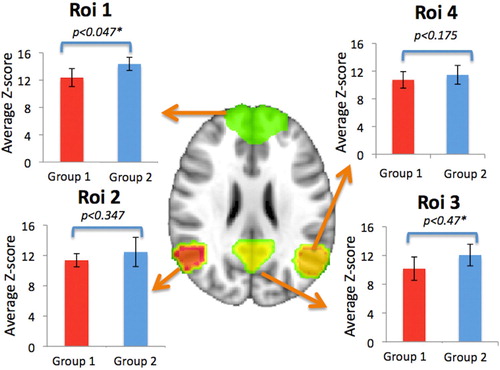
Figure 4. Dynamic connectivity of the left and right thalamus showing average Shannon’s Entropy measures with 1 standard deviation from the mean. Results from Mann-Whitney U-tests at p < 0.05 denoted by *. (Group 1 = injured/traumatic, Group 2 = patriotic).
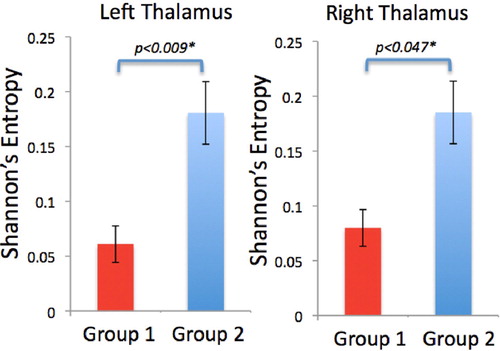
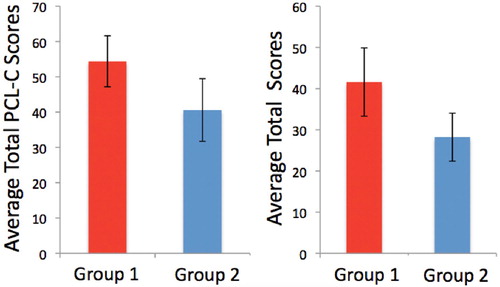
Figure 5. Average Total PCL-C scores and average total NSI scores with 1 standard error from the mean. Group 2 had overall lower total PCL-C and NSI scores. (Group 1 = injured/traumatic, Group 2 = patriotic).