
Figures & data
Table 1. Art-based interventions over 12 weeks.
Figure 1. The Children’s Hope Scale.
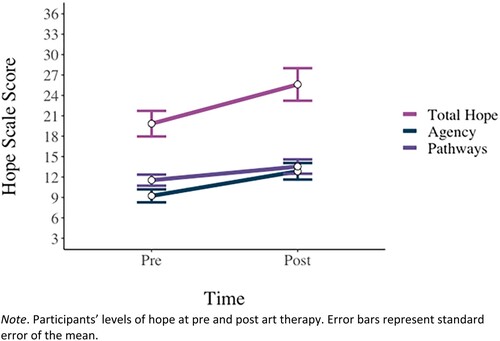
Table 2. Descriptive statistics at pre and post art therapy (N = 13).
Figure 2. The Resilience Scale.
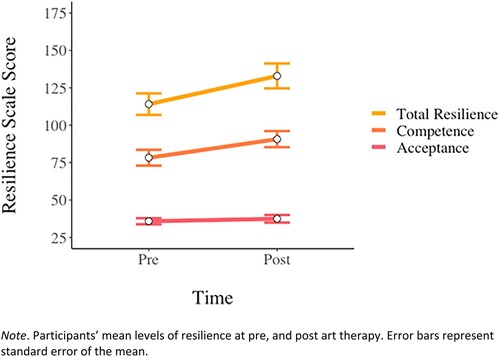
Table 3. Interrater agreement on coding of BDP categories.
Table 4. Percentage of participants under each BDP rating category.
Figure 3. Pre- and post- bridge drawing with path.
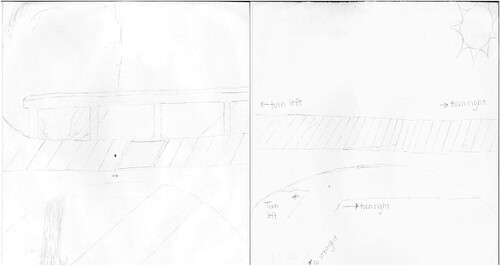
Figure 4. Participants’ responses on the Client Satisfaction Survey.
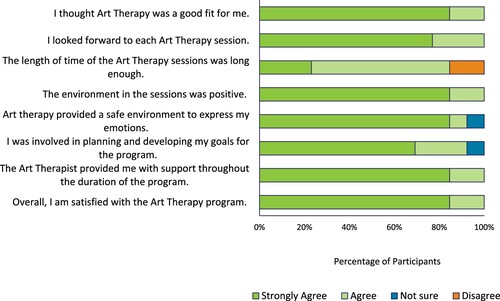
Table 5. Participants’ written responses on the Client Satisfaction Survey.