Figures & data
Table 1. Results from multinomial logit model.
Figure 1. Predicted probabilities based on results from .
Note: Grey area shows 95 percent confidence interval.
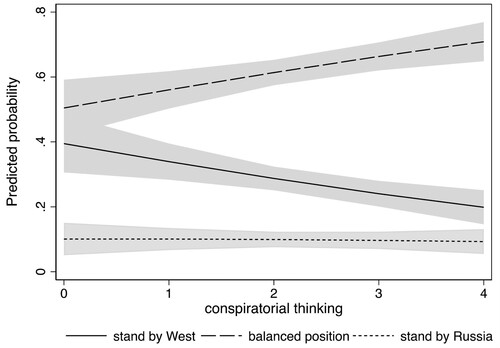
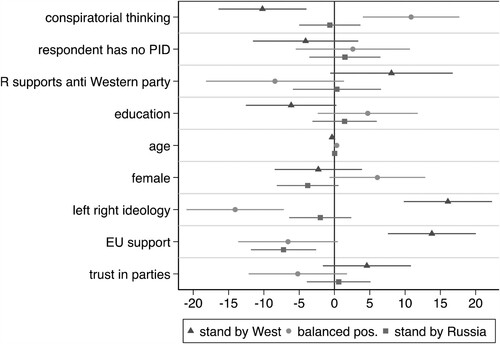
Figure 2. Marginal effects of a two standard deviation change of independent variables.
Note: Marginal effects of a two standard deviation change of independent variables on each of the categories of the dependent variable. Lines represent 95 percent confidence intervals.