Figures & data
Table 1. New party types.
Table 2. Multilevel logistic regression analyses.
Figure 1. Ideological Distance and Voting for a New Party Predicted probability of voting for a new party with 95% confidence intervals. X-axis depicts the distance between a respondent and the closest established party. All positions were recalculated to a zero-to-one scale, even when scales with different distances had been used. X-axis cut at 0.4 although empirically the maximum value is 0.8, but only 48 cases (0.3%) are higher than 0.4. Based on Model 2. Confidence intervals reflect both the uncertainty in the coefficients and the random intercepts.
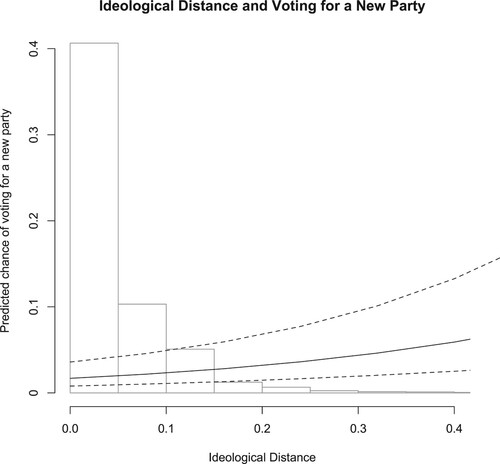
Figure 2. Mean Attention and Voting for a New Party. Predicted probability of voting for a new party with 95% confidence intervals. X-axis depicts the weighted mean attention that established party devote to the issue that voters prioritize. Based on Model 2. Confidence intervals reflect both the uncertainty in the coefficients and the random intercepts.
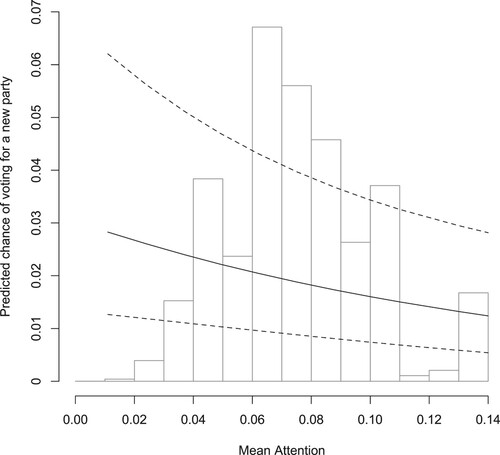
Figure 3. Political Cynicism and Voting for a New Party. Predicted probability of voting for a new party with 95% confidence intervals. Based on Model 2. Confidence intervals reflect both the uncertainty in the coefficients and the random intercepts.
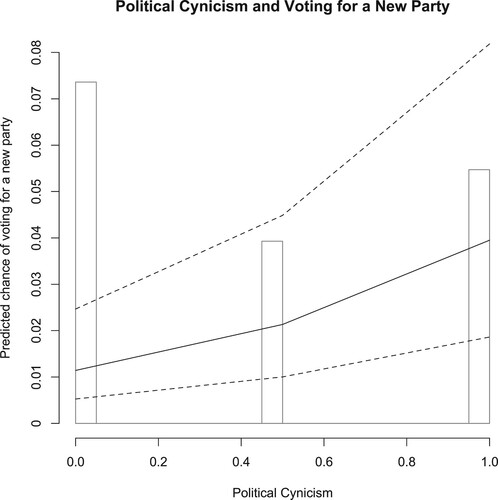
Figure 4. Control variables Predicted chance of voting for a new party with 95% confidence intervals. Based on Model 2. Confidence intervals reflect both the uncertainty in the coefficients and the random intercepts.
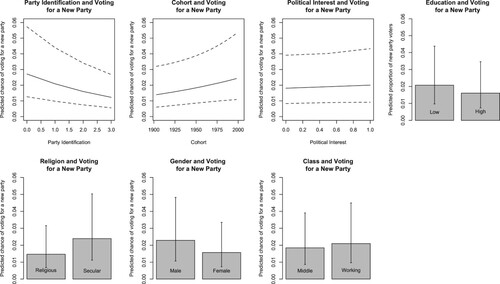
Figure 5. Difference in Ideological Distance between the Closest New and Established Parties. Predicted probability of voting for a new party with 95% confidence intervals. X-axis depicts the absolute difference between the respondent’s left-right distance to the closest new and the closest established party. Positive values imply a shorter distance to a new party and negative values imply a shorter distance to an established party. Based on Model A20. Confidence intervals reflect both the uncertainty in the coefficients and the random intercepts.
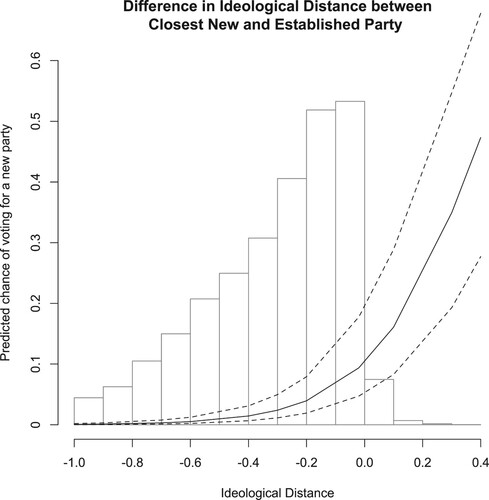
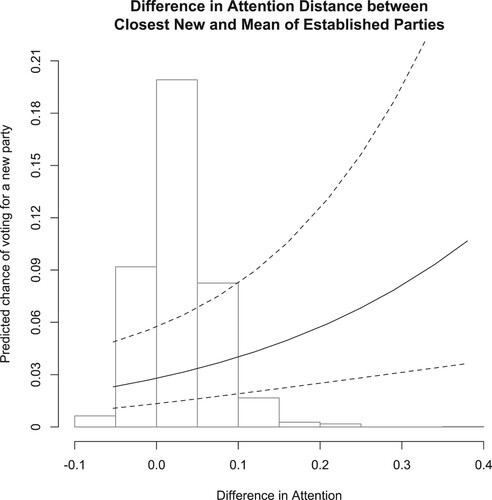
Figure 6. Difference in Attention between the Closest New Party and Weighted Mean of Established Parties Predicted probability of voting for a new party with 95% confidence intervals. X-axis depicts the difference in attention devoted to the issue the voters prioritize between (1) the new party that spend most attention to it and (2) the weighted mean of established parties. Positive values imply that a new party spend more attention on the isue and negative values imply an established party spend more attention on the issue. Based on Model A20. Confidence intervals reflect both the uncertainty in the coefficients and the random intercepts.