
Figures & data
Figure 1. Distribution of outcome variable. Source: Own analysis based on Fieldhouse et al. (Citation2017).
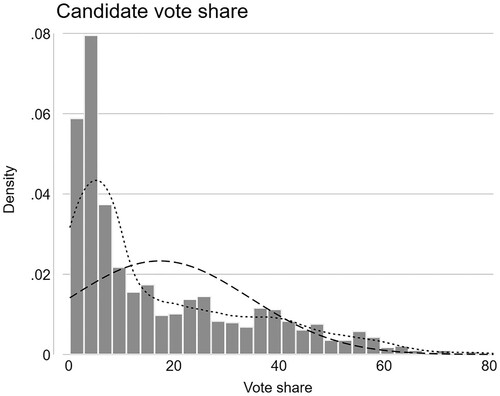
Figure 2. Harassment during UK electoral campaign. Source: Collignon and Rüdig Citation2020; Representative Audit of Britain 2017, 2019.
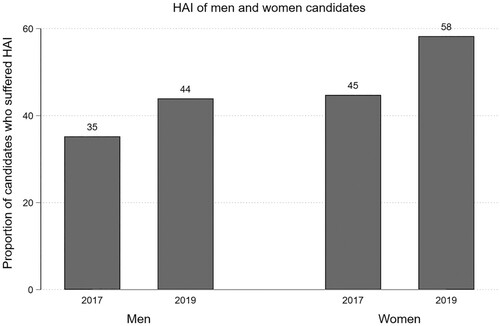
Table 1. Coeffects and standard errors from log-linear and binary regressions.
Figure 3. Coefficients and standard errors (in parentheses) of GSEM model. Source: Representative Audit of Britain 2019.
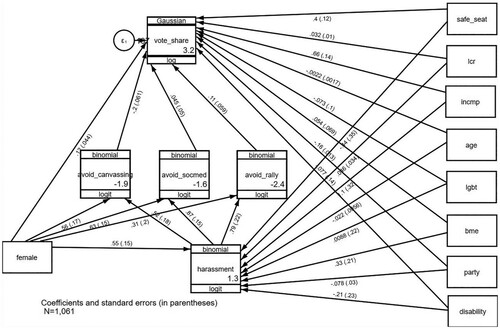
Table 2. Coefficients and t-statistics of GSEM model explaining vote share.
Table A1. Descriptive statistics (unweighted).
Table A2. Response rate by party.
Table A3. Types of harassment during 2019 GE campaign (weighted).
Table A4. Proportion of candidate that modified their behaviour as a result of harassment.