
Figures & data
Table 1. Political History Model: Seemingly unrelated regression models explaining vote share of Fianna Fáil, Fine Gael, Independents, and the Left bloc as a function of government incumbency, short-term popular support, and shocks in Irish elections 1951–2020.
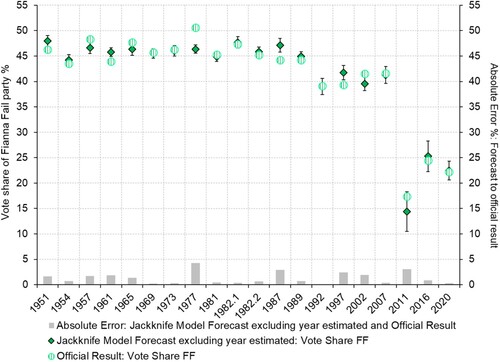
Figure 1. Out-of-sample forecasts of Fianna Fáil vote share (diamonds) using a jackknife approach compared with official results of 20 Irish general elections 1951–2020 (circles) with vertical bars from diamonds representing 95% confidence intervals associated with estimates. Note: Grey bars are the absolute error between the forecast and official result.
Supplemental material