
Figures & data
Figure 1. Map of India and location of Rajasthan state (top left), districts and national highway network with district census IDs in ellipses (bottom left) and 6-year average (and 95% confidence interval) of road death rates of the districts (right).
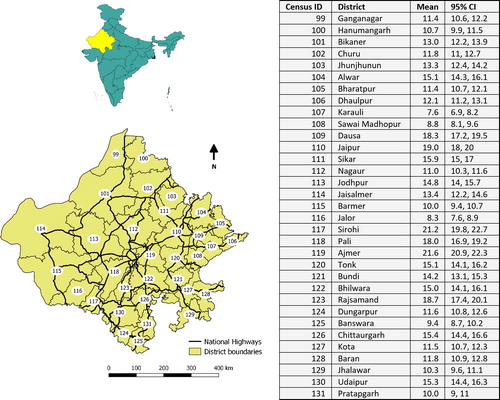
Table 1. Descriptive statistics of study variables for 33 districts.
Figure 2. Snapshot of geocoded heavy vehicles and villages along with 1 km buffer around National Highways.
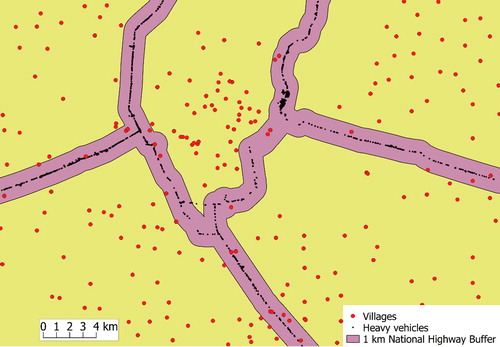
Figure 3. A Google Earth screenshot of the satellite imagery showing trucks on the highway and nearby land-use (source: Google Earth snapshot).
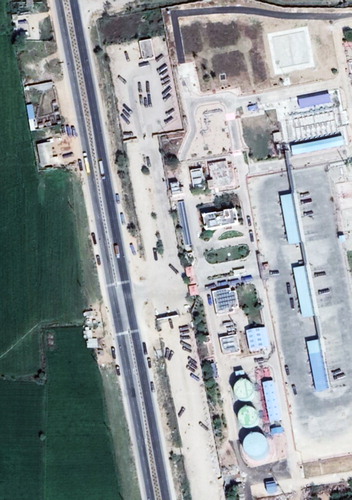
Figure 4. Temporal effect of fatality rates.
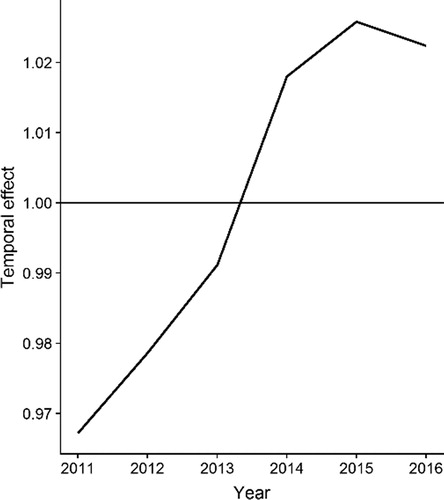
Figure 5. Observed freight tonnage and GE estimates of heavy vehicle density for selected road sections.
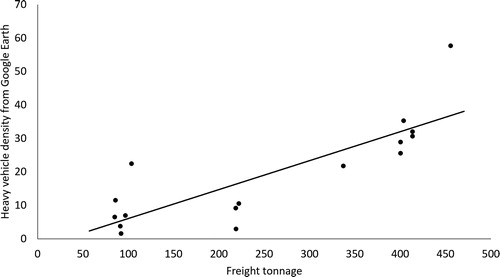
Figure 6. A scatterplot showing district-level death rates and heavy vehicle density on national highways.
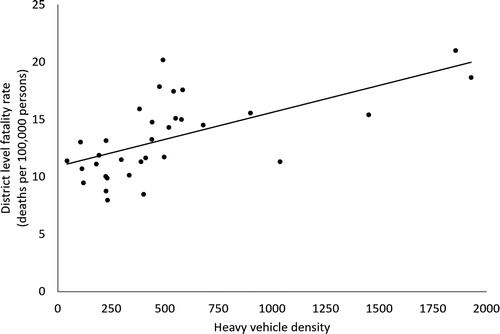
Figure 7. Year-specific fatality rates of districts of Rajasthan state.
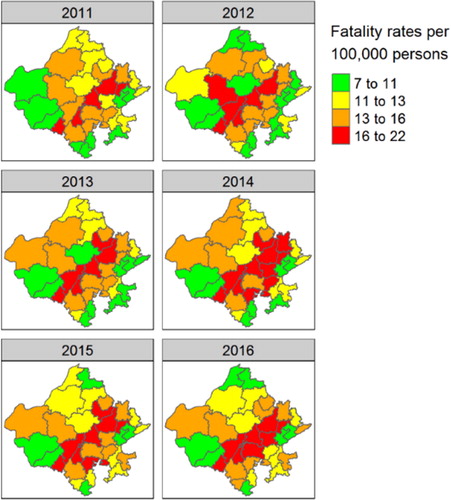
Table 2. Regression results.
Figure 8. A six-lane national highway passing through a village (Source: Google Earth snapshot).
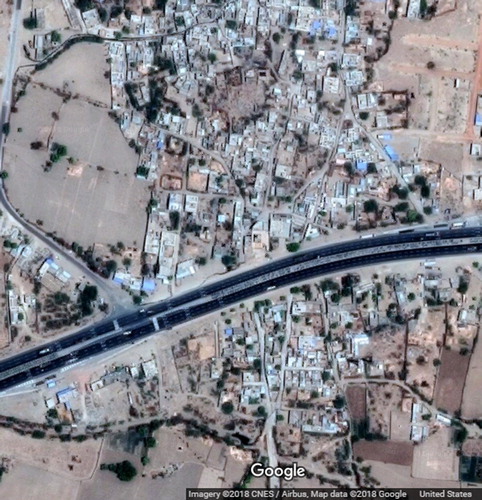
Table A1. Regression model using fatality data for the 6-year period from 2011 to 2016.