Figures & data
Figure 1. Equipment used in the experiment.
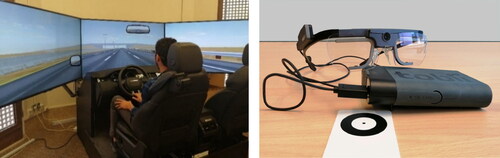
Figure 2. Control expressway scenario with the real and simulated driving environment.
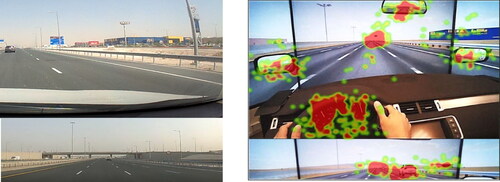
Figure 3. VMS with a general safety message.

Table 1. Overview of VMS test scenarios (without control condition) and the surrounding features.
Table 2. Overview of the gaze parameters.
TABLE 3. Demographics of sample (n = 79).
Figure 4. Time to first fixation on VMS (median and interquartile range).
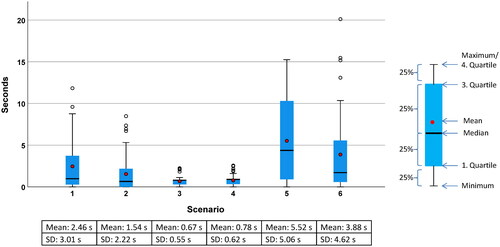
Figure 5. VMS fixation count (median and interquartile range).
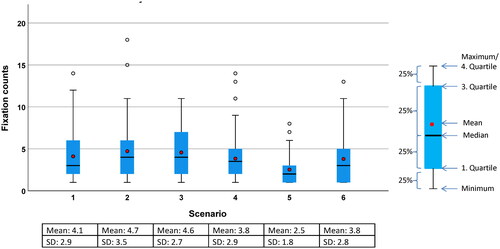
Figure 6. First fixation duration: average vs. first exposure.
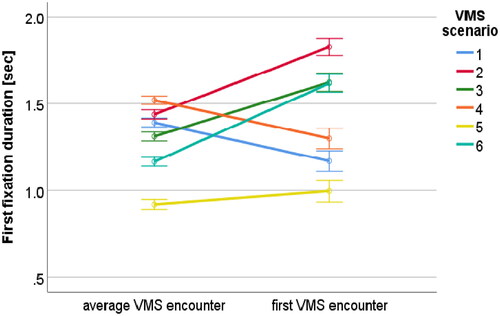
Figure 7. Fixation duration on VMS (median and interquartile range).
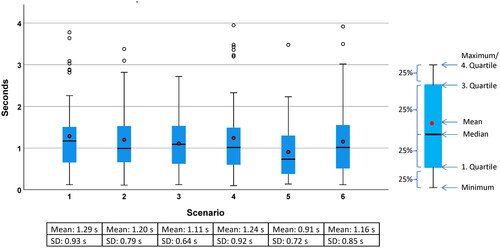
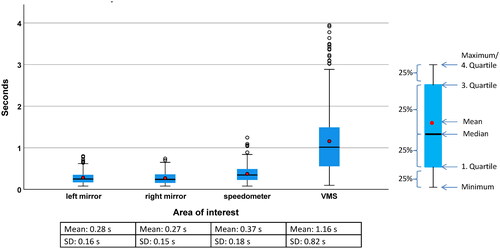
Figure 8. Fixation duration on areas of interest.