Figures & data
Figure 1. UV-visible spectra of gold colloids: spectra recorded after the methanol extract of E. camaldulensis (10 mL) was added to 90 mL of the chloroauric acid solution (1 mM). The curves are recorded after periods of 15 min (a) and 8 weeks (b).
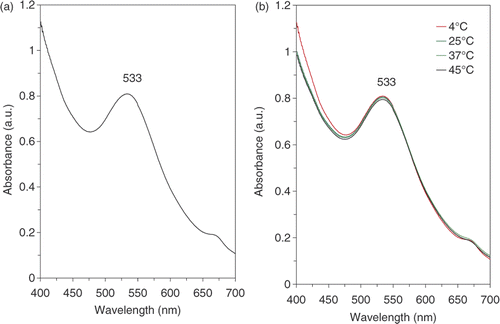
Table 1. The maximum wavelength (nm) of the colloid samples obtained during the stability test of the gold nanoparticles prepared by the methanol extract of E. camaldulensis.
Figure 2. TEMs recorded from a small region of a drop-coated film of chloroauric acid solution treated with the methanol extracts of E. camaldulensis (right picture) for 15 min (scale bars correspond to 50 nm). The related particle size distribution histograms (left picture) obtained after 350 individual particles were counted.
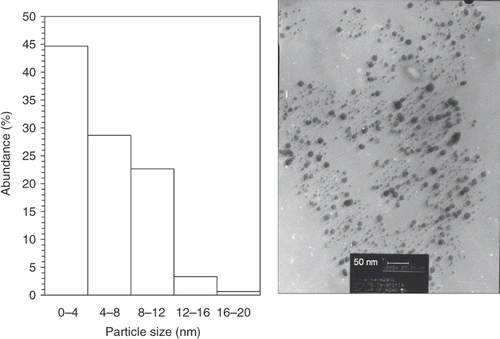
Figure 3. TEMs recorded from a small region of a drop-coated film of gold colloid prepared using methanol extracts of E. camaldulensis and reserved at 4°C (right picture) for 8 weeks (scale bars correspond to 50 nm). The related particle size distribution histograms (left picture) obtained after 350 individual particles were counted.
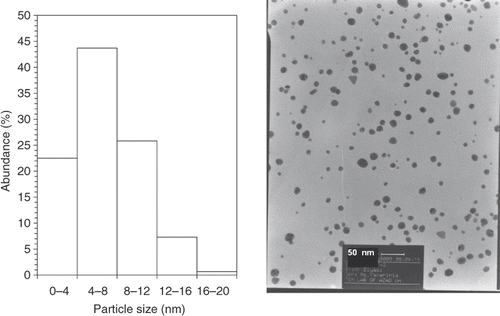
Figure 4. TEMs recorded from a small region of a drop-coated film of gold colloid prepared using the methanol extract of E. camaldulensis and reserved at 45°C (right picture) for 8 weeks (scale bars correspond to 50 nm). The related particle size distribution histograms (left picture) obtained after 350 individual particles were counted.
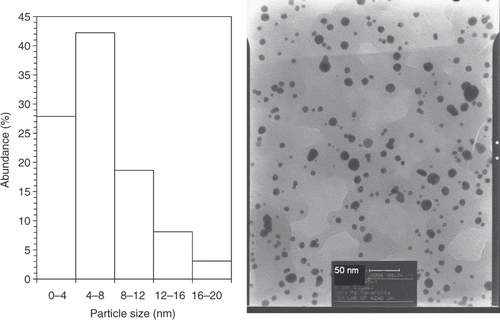
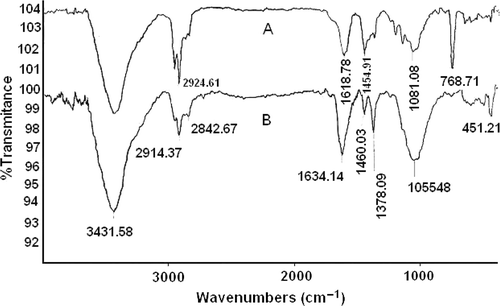
Figure 5. The FT–IR spectra of the as-prepared gold nanoparticles synthesised using the methanol extract of E. camaldulensis (A) and gold nanoparticles treated with diluted acetic acid (B).