1,424
Views
48
CrossRef citations to date
0
Altmetric
Original Articles

Functionalised gold nanoparticles for selective induction of in vitro apoptosis among human cancer cell lines

, , , &
Pages 32-45 | Received 19 Nov 2009, Accepted 21 Jan 2011, Published online: 05 Mar 2012

Figures & data

Figure 1. (Colour online) Absorption spectra of GNP functionalised with citrate in blue and GNP functionalised with PEI in red.
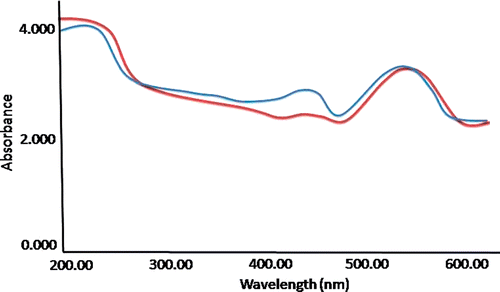
Figure 1. (Colour online) Absorption spectra of GNP functionalised with citrate in blue and GNP functionalised with PEI in red.

Figure 2. FT-IR spectra of (a) Sodium citrate (b) Gold/citrate and (c) PEI and (d) Gold/PEI.

Figure 2. FT-IR spectra of (a) Sodium citrate (b) Gold/citrate and (c) PEI and (d) Gold/PEI.

Figure 3. Dynamic light scattering distribution of (a) GNP/Citrate and (b) GNP/PEI.

Figure 3. Dynamic light scattering distribution of (a) GNP/Citrate and (b) GNP/PEI.

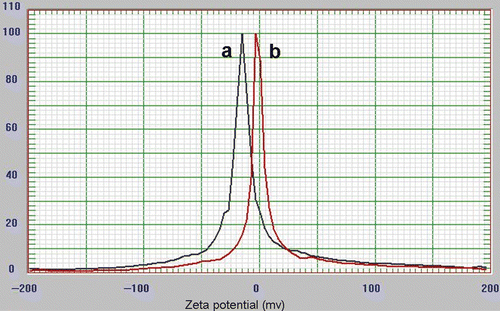
Figure 4. Zeta potential distribution of (a) GNP/Citrate and (b) GNP/PEI.

Figure 4. Zeta potential distribution of (a) GNP/Citrate and (b) GNP/PEI.

Figure 5. (a) Representation of the topographic image of gold nano particles functionalised with citrate and (b) representation of the topographic image of gold nano particles functionalised with PEI.
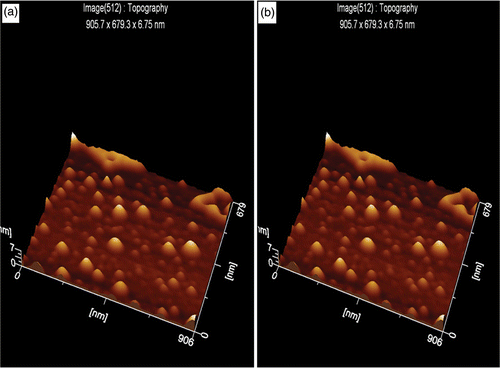
Figure 5. (a) Representation of the topographic image of gold nano particles functionalised with citrate and (b) representation of the topographic image of gold nano particles functionalised with PEI.

Figure 6. (a) Cell viability assay by MTT shows reduction in viability of A549 cells with increase in concentrations of GNP/citrate nanoparticles. No significant effect on cellular viability was observed with GNP/PEI and (b) cell viability assays by MTT shows no significant effect on the viability of MCF-7. No significant reduction in viability observed in GNP/PEI and GNP/citrate on MCF-7.
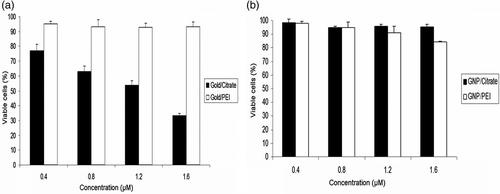
Figure 6. (a) Cell viability assay by MTT shows reduction in viability of A549 cells with increase in concentrations of GNP/citrate nanoparticles. No significant effect on cellular viability was observed with GNP/PEI and (b) cell viability assays by MTT shows no significant effect on the viability of MCF-7. No significant reduction in viability observed in GNP/PEI and GNP/citrate on MCF-7.

Figure 7. (Colour online) Dot plots show that treatment of A549 cells with GNP/citrate leads to apoptosis in a concentration-dependent manner. (a) 0.4, (b) 0.8, (c) 1.2 and (d) 1.6 µM. The gradual shifting of the A549 cell population towards the P2 population with increase in the GNP/citrate concentration indicates increase in the percentage of apoptosis. (e) Dot plot for untreated cells used as control and (f) Dot plots show that treatment of A549 cells with GNP/PEI at 1.6 µM concentration.
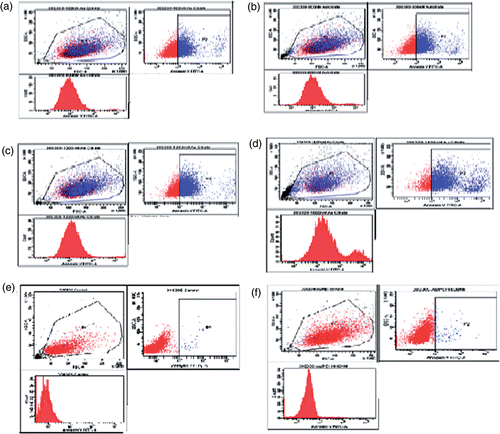
Figure 7. (Colour online) Dot plots show that treatment of A549 cells with GNP/citrate leads to apoptosis in a concentration-dependent manner. (a) 0.4, (b) 0.8, (c) 1.2 and (d) 1.6 µM. The gradual shifting of the A549 cell population towards the P2 population with increase in the GNP/citrate concentration indicates increase in the percentage of apoptosis. (e) Dot plot for untreated cells used as control and (f) Dot plots show that treatment of A549 cells with GNP/PEI at 1.6 µM concentration.

Figure 8. Representative curve of A549 cell death: percent of Annexin V positive cells, which shows a proportional increase with concentration of GNP/citrate.
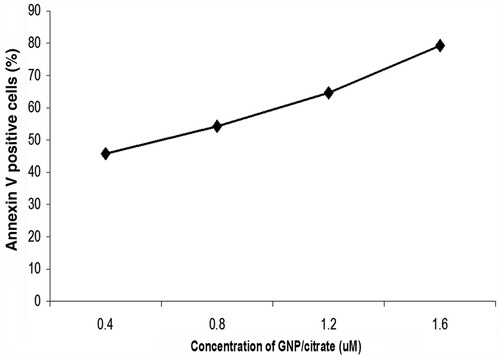
Figure 8. Representative curve of A549 cell death: percent of Annexin V positive cells, which shows a proportional increase with concentration of GNP/citrate.

Figure 9. (a) 500× image of GNP/PEI-treatedA549 and (b) 2000× image of GNP/PEI-treated cells (c) 500× image of GNP/citrate-treated A549 cells and (d) 2000× image of GNP/citrate-treated cells.
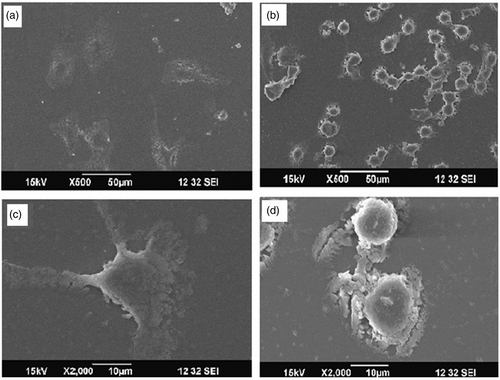
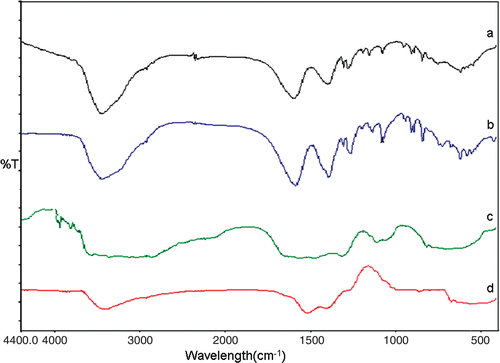
Figure 9. (a) 500× image of GNP/PEI-treatedA549 and (b) 2000× image of GNP/PEI-treated cells (c) 500× image of GNP/citrate-treated A549 cells and (d) 2000× image of GNP/citrate-treated cells.
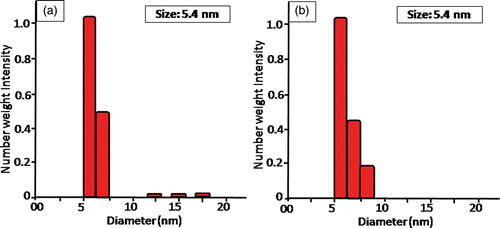
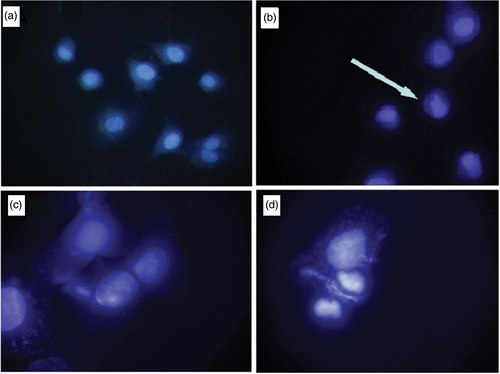
Figure 10. (Colour online) (a) 40× image of the A549 cells treated with GNP/PEI (b) 100× image of the A549 cells treated with GNP/PEI, (c) 40× image of the A549 cells treated with GNP/citrate and (d) 100× image of the A549 cells treated with GNP/Citrate.

Figure 10. (Colour online) (a) 40× image of the A549 cells treated with GNP/PEI (b) 100× image of the A549 cells treated with GNP/PEI, (c) 40× image of the A549 cells treated with GNP/citrate and (d) 100× image of the A549 cells treated with GNP/Citrate.

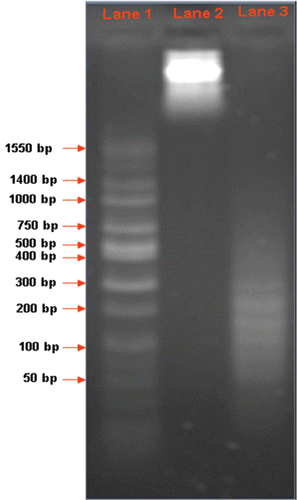
Figure 11. (Lane 1) wide-range DNA ladder sequence. (Lane 2) Total genomic DNA from untreated A549 cells. (Lane 3) Total genomic DNA from treated A549 cells.

Figure 11. (Lane 1) wide-range DNA ladder sequence. (Lane 2) Total genomic DNA from untreated A549 cells. (Lane 3) Total genomic DNA from treated A549 cells.

Reprints and Corporate Permissions

Please note: Selecting permissions does not provide access to the full text of the article, please see our help page How do I view content?

To request a reprint or corporate permissions for this article, please click on the relevant link below:

Academic Permissions

Please note: Selecting permissions does not provide access to the full text of the article, please see our help page How do I view content?

Obtain permissions instantly via Rightslink by clicking on the button below:

If you are unable to obtain permissions via Rightslink, please complete and submit this Permissions form. For more information, please visit our Permissions help page.