Figures & data
Figure 1. (Colour online) Comparative optical photographs denoting the colour change of the plant extract. (a) Aqueous leaf extract of P. maderaspatensis (control) and (b) aqueous leaf extract of P. maderaspatensis treated with 1 mM AgNO3 observed within 30 min of incubation time.
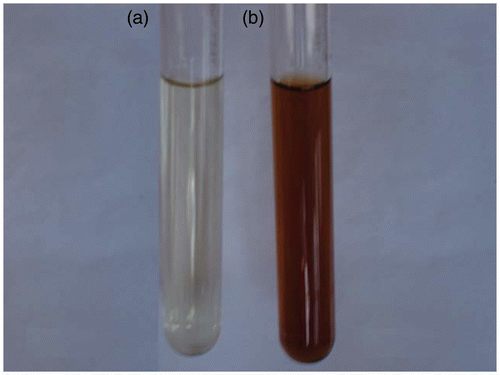
Figure 2. UV–vis spectrum of Ag NPs recorded as a function of reaction time from 0 to 24 h. (Abs, absorbance; nm, wavelength in nanometre).
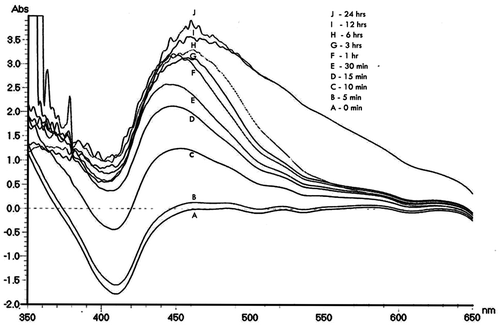
Figure 3. (a, b) SEM image of Ag NPs; (c) particle size analysis showing 91.9% of NPs of size 71.7 nm; and (d) XRD pattern of the biosynthesised Ag NPs.
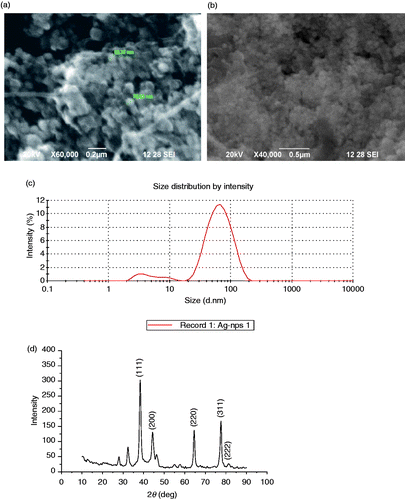
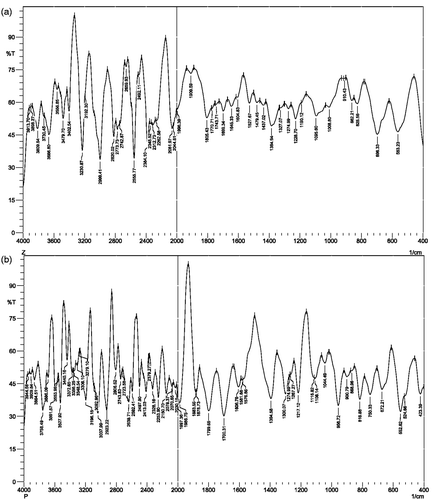
Figure 4. FTIR absorption spectra of the P. maderaspatensis leaf biomass: (a) before bioreduction and (b) after bioreduction with Ag NO3.