Figures & data
Table 1. Commercial source and description of manufactured nanoparticles.
Figure 1. TEM images of particles used in this study. (a) 5 nm TiO2; (b) 200 nm TiO2; (c) 10 nm Al2O3 and (d) 50 nm Al2O3.
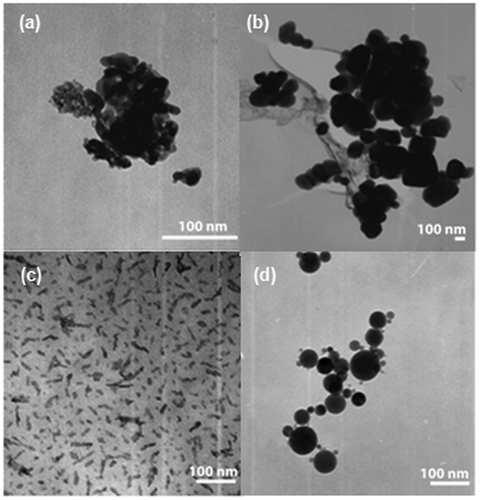
Table 2. Particle characterisation by DLS, SMPS.
Figure 2. Effect of NP exposure on cell viability, as determined by the colony number after a 5-day exposure. Asterisk (*) represents significant difference from the control group (p ≤ 0.05).
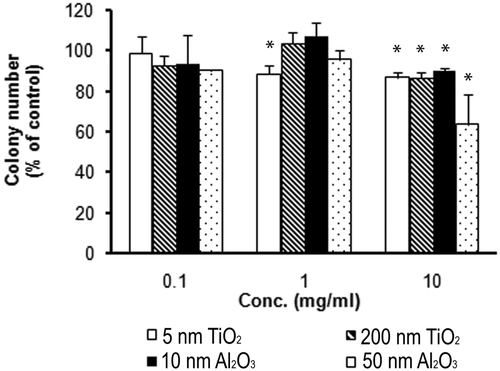
Figure 3. Effect of NP exposure on cell proliferation, as determined by average cell number per colony after: (a) 2-day exposure; (b) 5-day exposure. Asterisk (*) denotes significant difference from the control group or between two comparing groups (p ≤ 0.05).
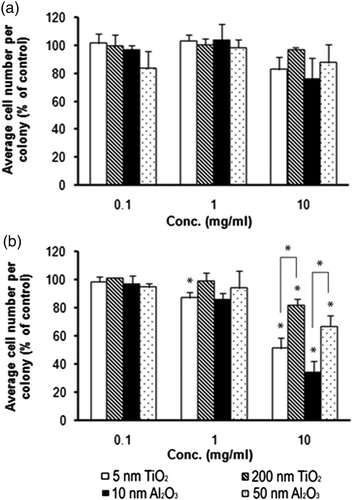
Figure 4. Cytotoxicity of metal NPs to A549 cells after a 5-day exposure determined by the alamarBlue®. Asterisk (*) represents significant difference from the control group or between two comparing groups (p ≤ 0.05).
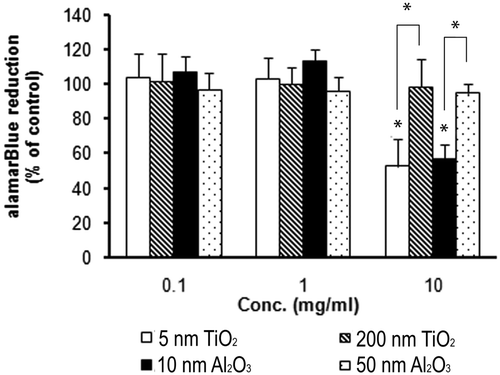
Figure 5. Comparison of cell proliferation of cell groups cultured with metal NP dispersion and the corresponding supernatant using a clonogenic assay. Asterisk (*) represents significant difference from the control group or between two comparing groups (p ≤ 0.05).
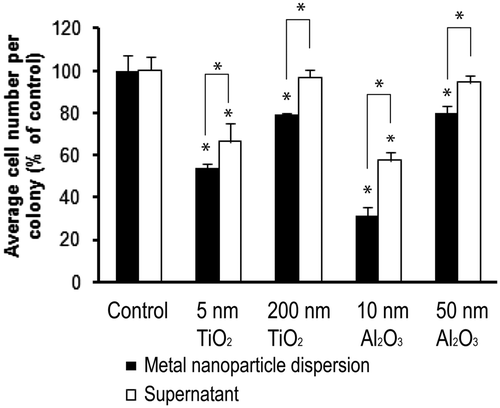
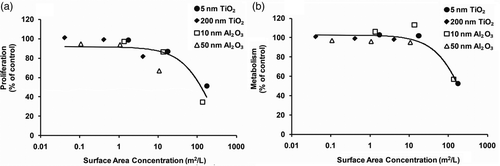
Figure 6. Cell response curves for 5 and 200 nm TiO2 and 10 and 50 nm Al2O3 NPs: (a) proliferation and (b) metabolism. Dose is expressed as surface area concentration (m2/L). The curve represents an exponential regression for the response.