Figures & data
Figure 1. XRD pattern of MgFe2O4 (S1) prepared by sol-gel method.
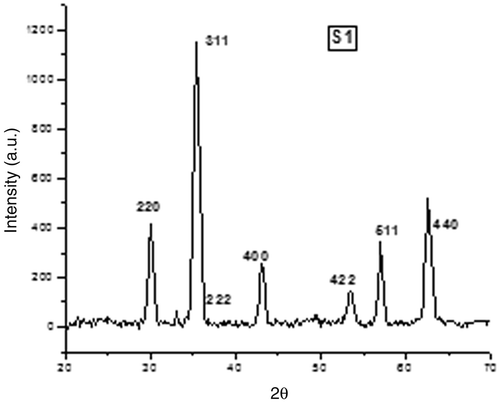
Figure 2. XRD pattern of MgFe2O4 (C1) prepared by co-precipitation method.
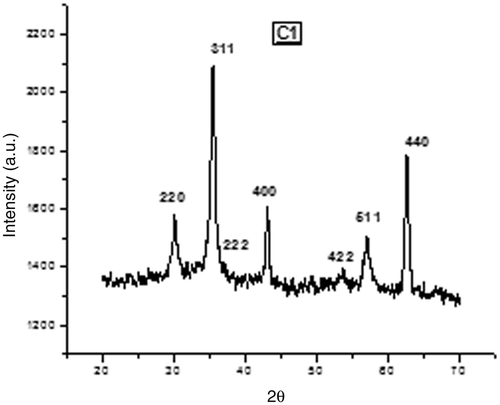
Table 1. Data on lattice parameter (a), crystalline size (D), X-ray density (ρ x) of MgFe2O4 prepared using sol-gel and co-precipitation techniques
Figure 3. FTIR spectra of MgFe2O4 samples S1 and C1.
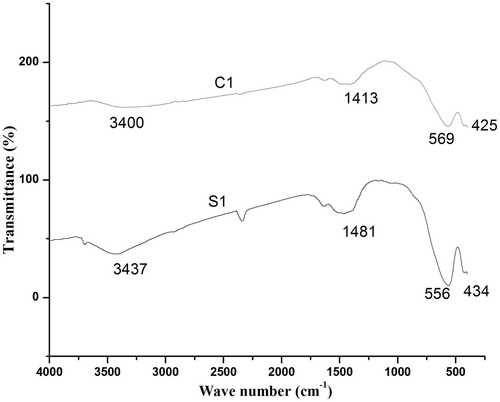
Figure 4. Hysteresis loop of MgFe2O4 samples S1 and C1.
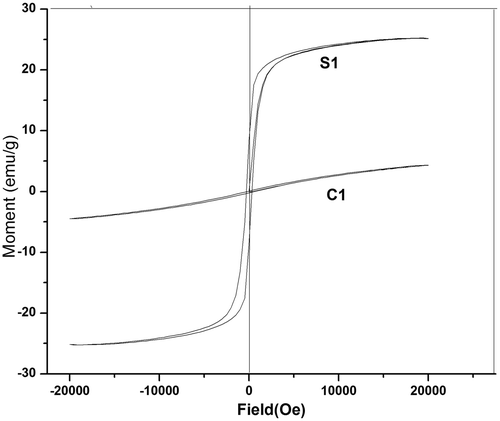
Table 2. Comparison of magnetic parameters of samples S1 and C1
Figure 5. Variation of dielectric constant (εr) of C1 with frequency at different temperatures.
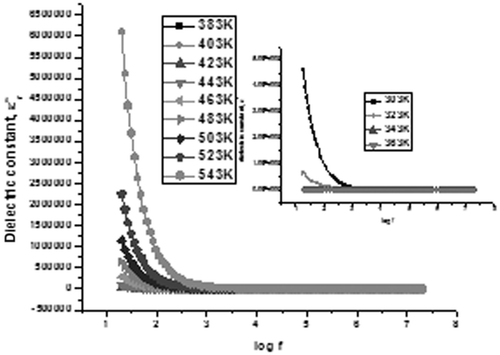
Figure 6. Variation of dielectric constant (εr) of S1 of with frequency at different temperatures.
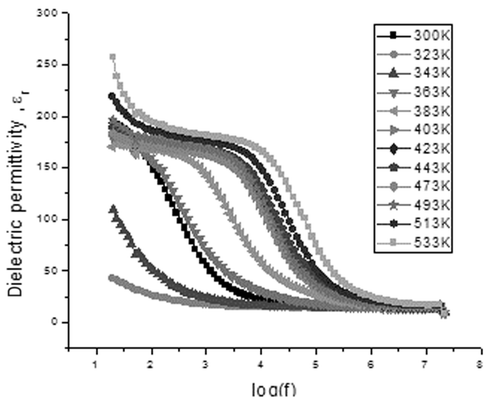
Figure 7. Variation of tanδ of C1 of with frequency at different temperatures.
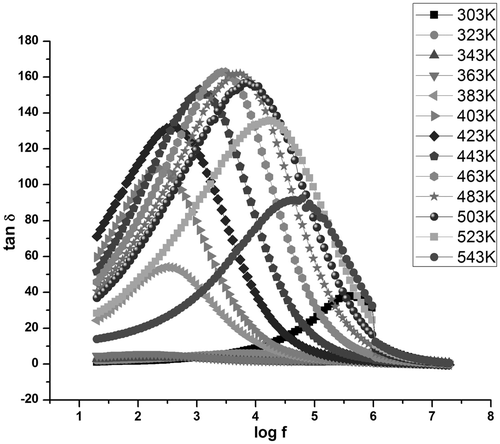
Figure 8. Variation of tanδ of S1 of with frequency at different temperatures.
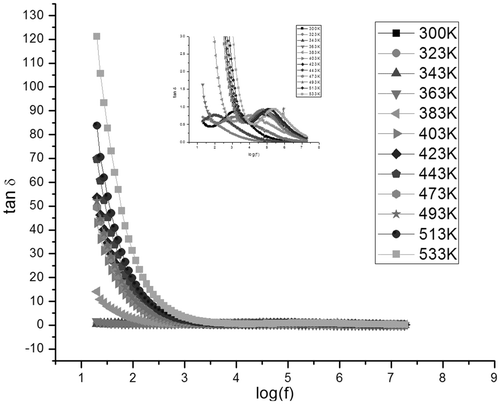
Figure 9. Variation of ac conductivity of C1 of with frequency at different temperature from 303 K to 363 K.
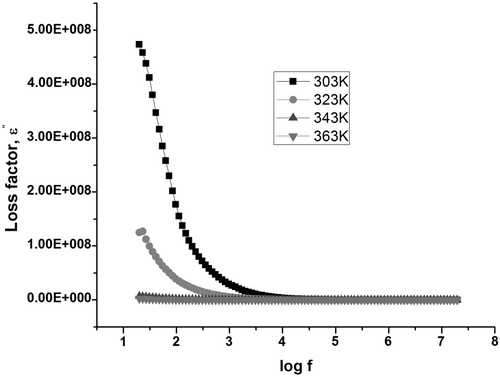
Figure 10. Variation of ac conductivity of C1 of with frequency at temperature from 383 K to 543 K.
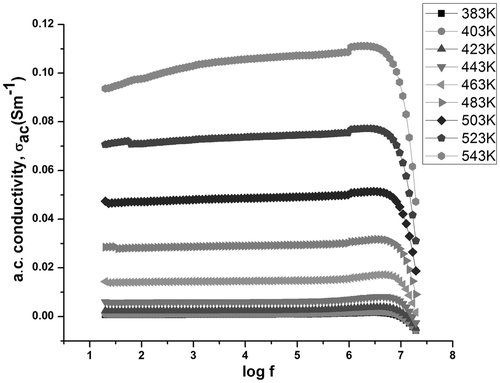
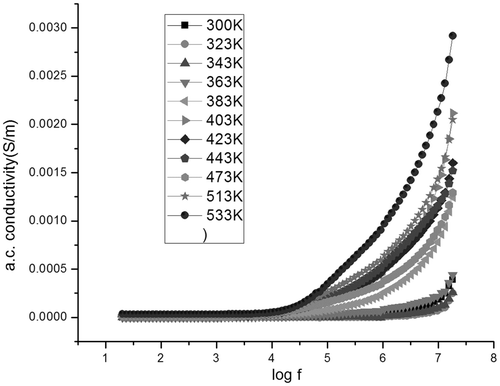
Figure 11. Variation of a.c. conductivity of S1 of with frequency at different temperatures.