Figures & data
Figure 1. Ag NPs prepared with (a) magnetic stirrer and (b) ultrasonicator. His–Ag NPs prepared by (c) magnetic stirrer and (d) ultrasonicator.
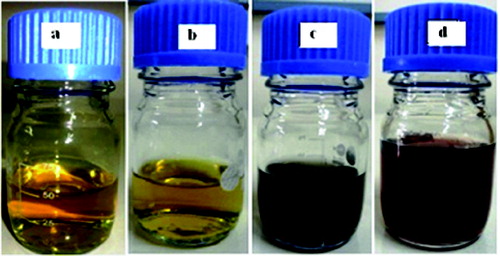
Figure 2. UV/Vis absorption spectra of Ag NPs for MS and US methods of stirring.
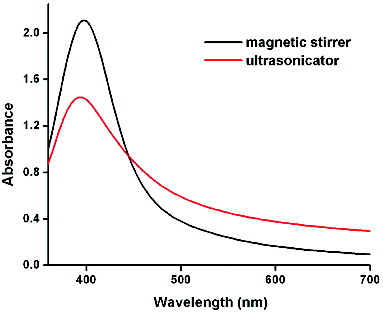
Figure 3. UV/Vis absorption spectra of Ag NPs at various days for the (a) MS and (b) US methods (inset shows the variation of the absorption maximum with time).
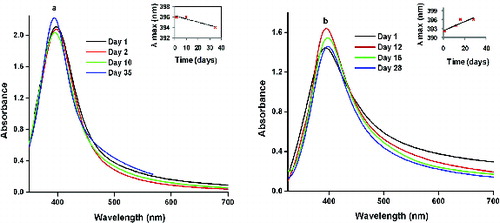
Figure 4. UV/Vis absorption spectrum of pure Ag and His–Ag colloidal solution for the (a) MS and (b) US methods.
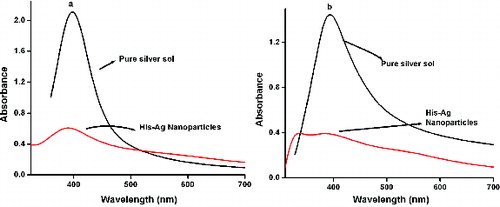
Figure 5. UV/Vis absorption spectra at different pH for the His–Ag colloidal solution prepared using (a) magnetic stirrer and (b) ultrasonicator.
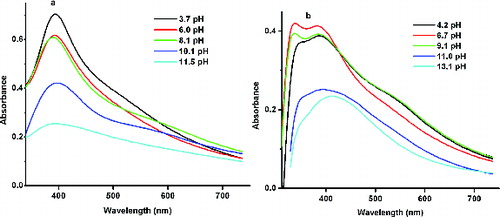
Figure 6. TEM image of the synthesised Ag NPs using MS method at different magnifications.
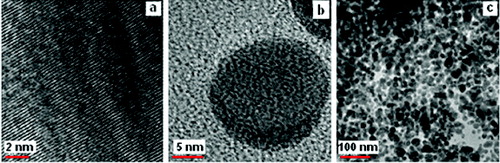
Figure 7. TEM image of the synthesised His–Ag NPs using MS method at different magnifications.
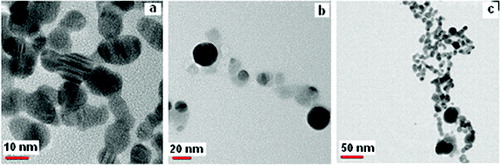
Figure 8. TEM image of the synthesised Ag NPs using US method at different magnifications.
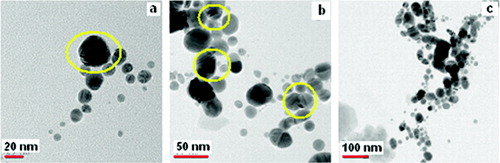
Figure 9. TEM image of the synthesised His–Ag NPs using US method at different magnifications.
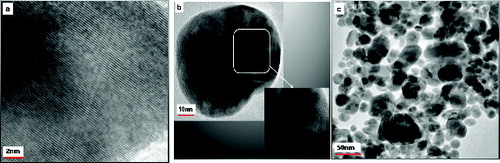
Table 1. nRS and SERS data and vibrational assignment of L-histidine on Ag for the MS and US methods.
Figure 10. (a). nRS of L-histidine and SERS of His–Ag NPs for (b) MS and (c) US methods.
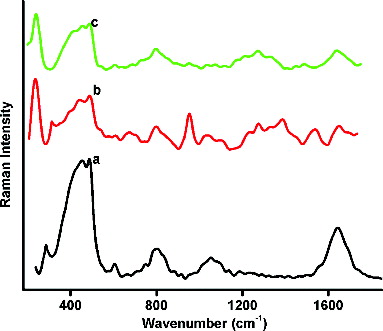
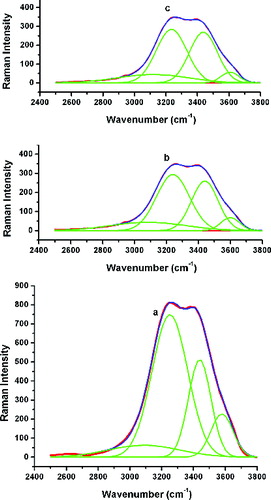
Figure 11. Deconvoluted (a) nRS of L-histidine and SERS of His–Ag NPs for the (b) MS and (c) US methods.