Figures & data
Figure 1. Schematic of UV-assisted electrochemical etching apparatus.
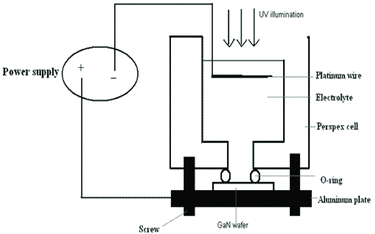
Figure 2. Flowchart of the MATLAB program.[Citation14]
![Figure 2. Flowchart of the MATLAB program.[Citation14]](/cms/asset/676767f3-f33a-4caf-9333-90ed12610713/tjen_a_814173_f0002_b.gif)
Figure 3. SEM images of different samples: (a) as grown (b) 20 mA/cm2 (c) 40 mA/cm2 and (d) 60 mA/cm2.
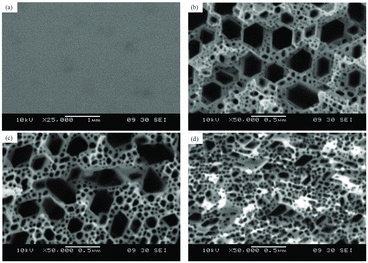
Figure 4. Image processing results of porous GaN structures.
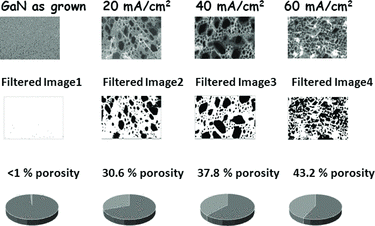
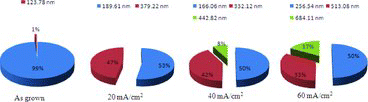
Figure 5. The percentage of pores in different diameters of the samples etched under different anodisation current densities.