Figures & data
Figure 1. XRD patterns of ZnO NR treated with (a) CTAB, (b) PVP and (c) HMT.
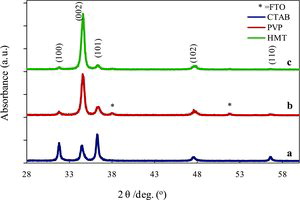
Figure 2. FESEM images quasi-1D ZnO NRs treated surfactant (a1) CTAB (b1) PVP (c1) HMT in low magnification, and (a2)–(c2) are (a1)–(c1) in high magnification. Insert is the cross section of (a1)–(c1), respectively. The scale bar is 100 nm.
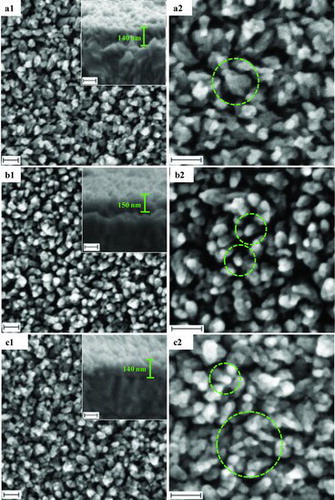
Figure 3. UV-visible spectra of ZnO nanostructure treated with various surfactants.
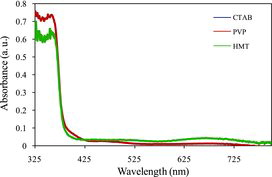
Table 1. Crystallite size and energy gap for the ZnO samples prepared with various surfactants.
Figure 4. Direct energy gap as a function of photon energy for the surfactant treated ZnO samples.
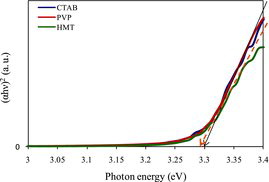
Figure 5. J–V curves of the cell utilising ZnO samples treated with various surfactants.
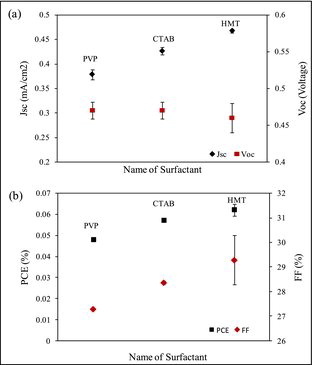
Figure 6. (a) Short-circuit current density and open-circuit voltage as a function of surfactant and (b) power conversion efficiency and fill factor as a function of various surfactant.