Figures & data
Figure 1. Schematic of the electrochemical working station.
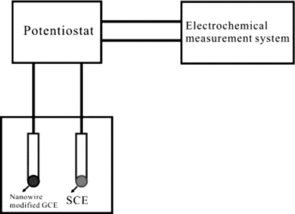
Figure 2. SEM image of the CuGeO3 nanowire modified GCE.
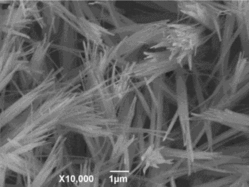
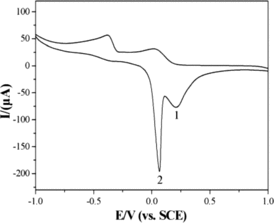
Figure 3. CVs of the bare GCE in 0.1 M KCl solution in absence (a) and presence (b) of 2 mM glyoxalic acid. CVs of the CuGeO3 nanowire modified GCE in 0.1 M KCl solution in absence (c) and presence (d) of 2 mM glyoxalic acid, scan rate, 50 mVs−1.
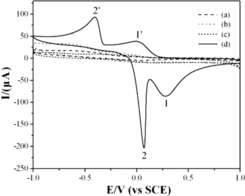
Figure 4. CVs of the CuGeO3 nanowire modified GCE in the mixed solution of 2 mM glyoxalic acid and different electrolytes. Scan rate, 50 mVs−1. (a) KBr, (b) NaOH, (c) H2SO4, (d) CH3COONa-CH3COOH.
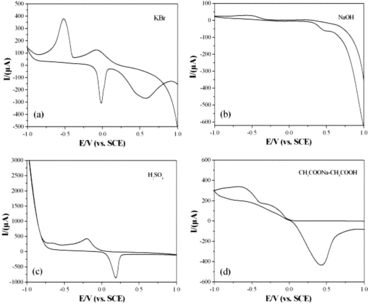
Figure 5. CVs of the CuGeO3 nanowire modified GCE in the mixed solution of 0.1 M KCl and 2 mM glyoxalic acid using different scan rates. The inset in the bottom-left part is the calibration plots of the intensities of anodic peaks against the scan rate.
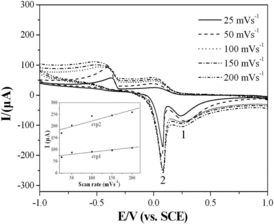
Table 1. Analytical data of the glyoxalic acid.
Figure 6. CVs of the glyoxalic acid with different concentrations at the CuGeO3 nanowire modified GCE. KCl, 0.1 M, scan rate, 50 mVs−1. The inset in the bottom-left part is the calibration plots of the intensities of anodic peaks against the concentrations of the glyoxalic acid.
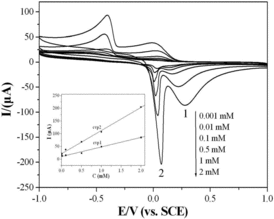
Figure 7. CV of the CuGeO3 nanowire modified GCE in 0.1 M KCl solution with 2 mM glyoxalic acid recycling for the 20th time. Scan rate, 50 mVs−1.