Figures & data
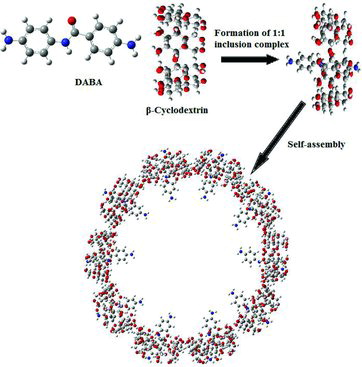
Figure 1. PM3-optimised structure of DABA.
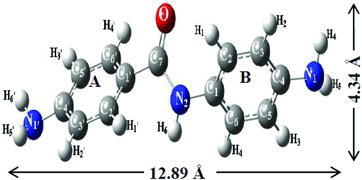
Table 1. Absorption and fluorescence maxima of DABA with different solvents, α-CD and β-CD concentrations.
Figure 2. Fluorescence spectra of DABA in different α-CD (a) and β-CD (b) concentrations (M): (1) 0, (2) 0.001, (3) 0.002, (4) 0.004, (5) 0.006, (6) 0.008 and (7) 0.01 (λexcitation − 300 nm). Inset figure: fluorescence intensity vs. α-CD and β-CD concentrations.
Table 2. Various prototropic maxima (absorption and fluorescence) of DABA in aqueous and β-CD medium.
Table 3. Geometrical parameters of DABA before and after inclusion with α-CD and β-CD for the most stable inclusion complexes.
Figure 3. (Colour online) Side and upper views of optimised DABA:CD inclusion complex: (a, b) DABA:α-CD, and (c, d) DABA:β-CD inclusion complexes. Blue, white, ash and bright red colours indicate nitrogen, hydrogen, carbon and oxygen atoms, respectively.
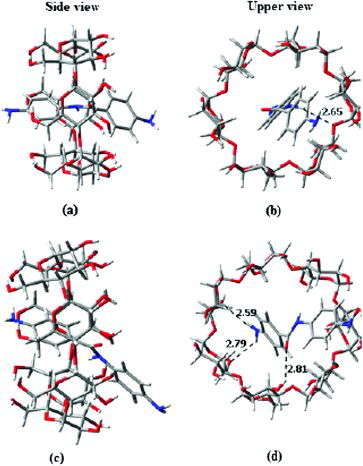
Table 4. HOMO–LUMO energies and thermodynamic parameter values for the DABA:CD inclusion complexes (using the PM3 method).
Figure 4. (Colour online) LUMO and HOMO pictures of isolated DABA and its inclusion complexes. Blue, white, ash and bright red colours indicate nitrogen, hydrogen, carbon and oxygen atoms, respectively. The green and dark red colours indicate negative and positive parts of the molecules, respectively.
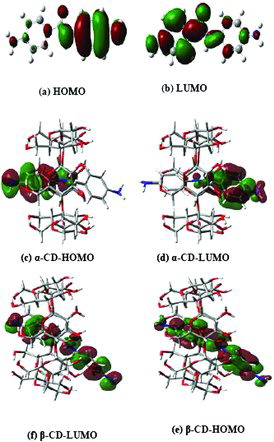
Figure 5. SEM images of (a) DABA, (b) α-CD, (c) β-CD, (d) DABA:α-CD and (e) DABA:β-CD inclusion complexes.
Figure 6. TEM images of the nanostructure formed by (a, b) α-CD/DABA and (c, d) β-CD/DABA.
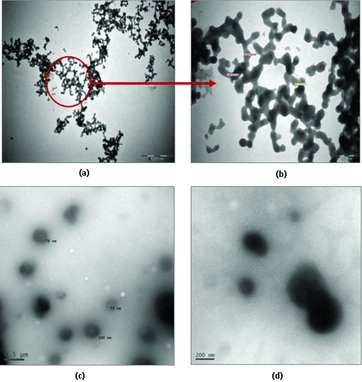
Figure 7. (Colour online) Graphical representation for a chain-like agglomerates formed by α-CD:DABA inclusion complex.
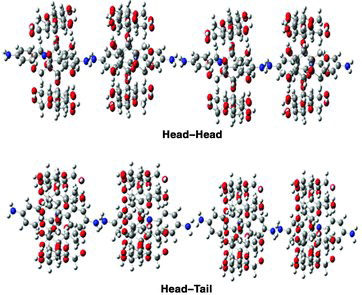
Figure 8. Proposed mechanisms of nanovesicle formation between DABA and β-CD.