Figures & data
Figure 1. XRD patterns of pure and Zr/Zr–Eu-doped ceria samples.
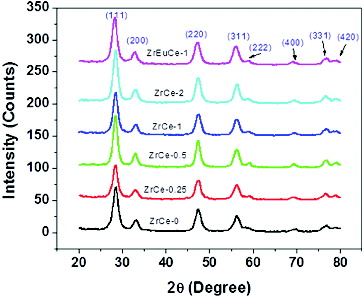
Table 1. Parameters calculated from XRD data.
Figure 2. Formation of Zr-doped ceria by precipitation-hydrothermal treatment route.
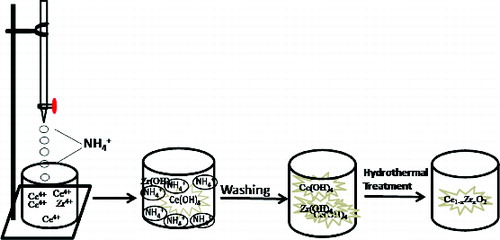
Figure 3. FTIR spectra of pure and Zr/Zr–Eu-doped ceria samples.
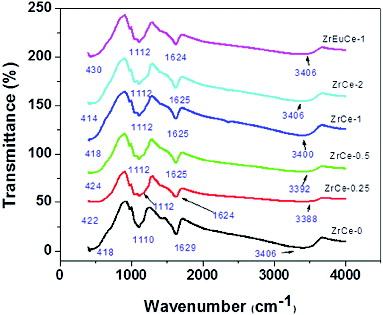
Figure 4. Raman spectra of pure and Zr/Zr–Eu-doped ceria samples.
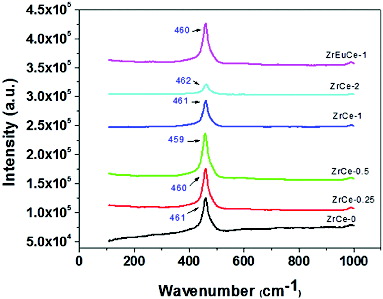
Figure 5. UV–vis absorption spectra of pure and Zr/Zr–Eu-doped ceria samples.
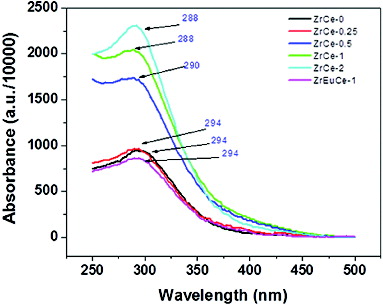
Figure 6. Direct band gaps of Zr/Zr–Eu-doped ceria samples (a) ZrCe-0, (b) ZrCe-0.25, (c) ZrCe-0.5, (d) ZrCe-1, (e) ZrCe-2 and (f) ZrEuCe-1.
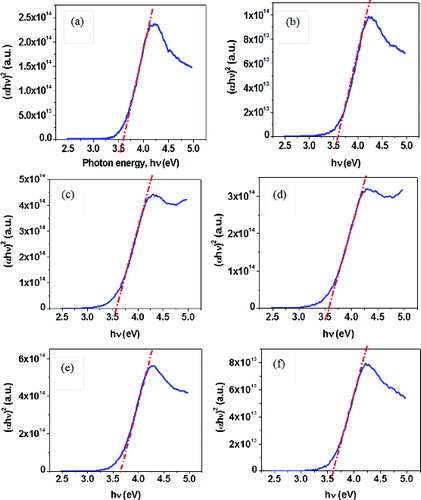
Table 2. Direct and indirect band gaps for Zr/Zr–Eu-doped ceria samples.
Figure 7. Indirect band gaps of pure and Zr/Zr–Eu-doped ceria samples (a) ZrCe-0, (b) ZrCe-0.25, (c) ZrCe-0.5, (d) ZrCe-1 samples, (e) ZrCe-2 and (f) ZrEuCe-1.
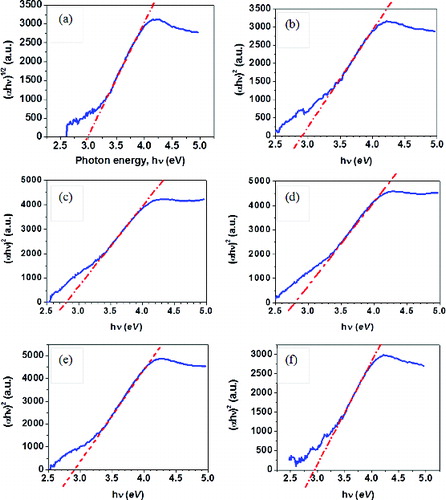
Figure 8. Emission spectra of pure and Zr/Zr–Eu-doped ceria samples excited at 270 nm.
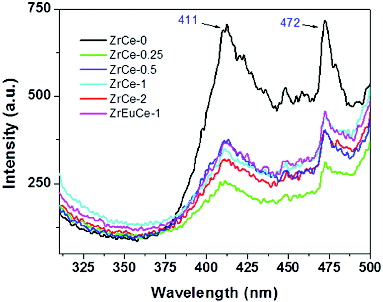
Figure 9. Emission spectra of pure and Zr/Zr–Eu-doped ceria samples excited at 500 nm.
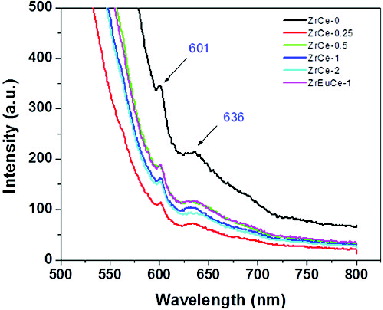
Figure 10. (a) TEM micrograph of ZrCe-2 sample and (b) the corresponding SAED pattern.
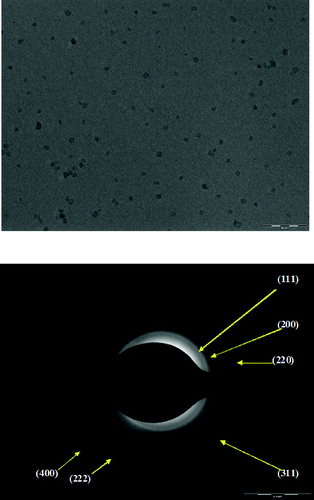
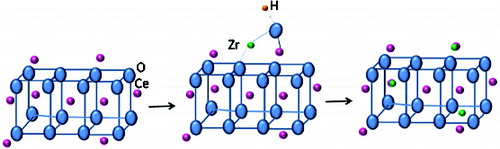
Figure 11. Schematic presentation of mode of incorporation of Zr in ceria lattice.