
Figures & data
Table 1. The IC50 of TAM, TAM-loaded SLN and SLN formulations on MCF-7 and MDA-MB231cells after 24, 48 and 72 h.
Figure 1. Phase contrast micrographs of MCF-7 cell treated with (A) vehicle (DMSO; control), (B) SLN (60 µg/mL) dispersed in DMSO, (C) TAM (12 µg/mL) dissolved in DMSO and (D) TAM-loaded SLN (12 µg/mL) dispersed in DMSO (magnification ×10).
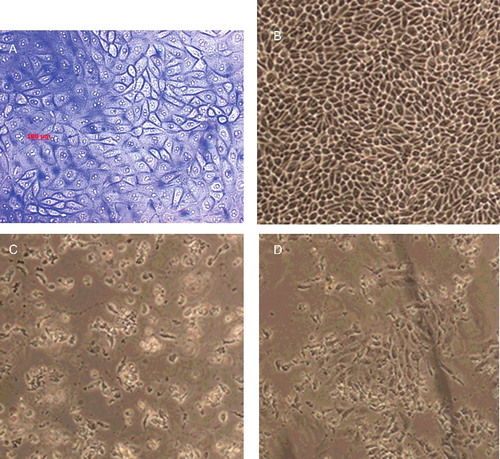
Figure 2. Phase contrast micrographs of MDA-MB231 cell treated with (A) vehicle (DMSO; control), (B) SLN (80 µg/mL) dispersed in DMSO, (C) TAM (16 µg/mL) dissolved in DMSO and (D) TAM-loaded SLN (16 µg/mL) dispersed in DMSO (magnification ×10).
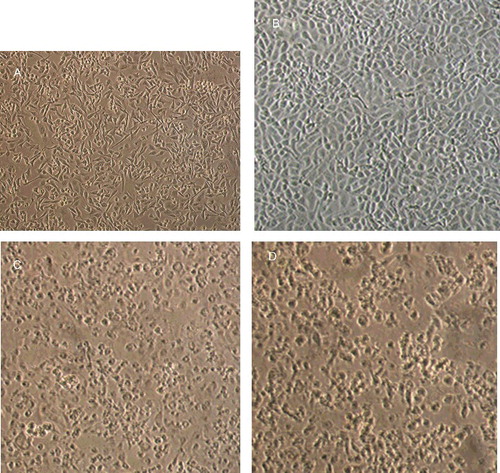
Figure 3. Fluorescence microscopy of MCF-7 cells treated with (A) vehicle, (DMSO; control), TAM (B) and TAM-loaded SLN (C). Cell shrinkage (thin arrow) and apoptotic cells are evident (thick arrow) (magnification ×40).
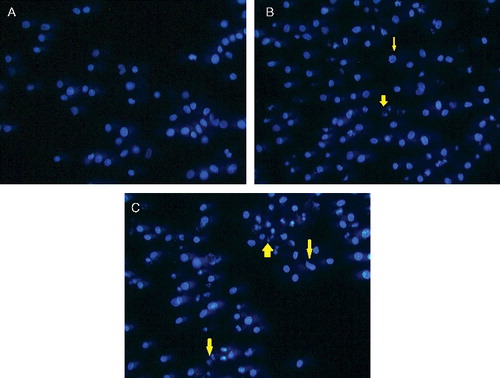
Figure 4. Fluorescence microscopy of MDA-MB231 cells treated with (A) vehicle, (DMSO; control), TAM (B) and TAM-loaded SLN (C). Cell shrinkage (thin arrow) and apoptotic cells (thick arrow) are evident (magnification ×40).
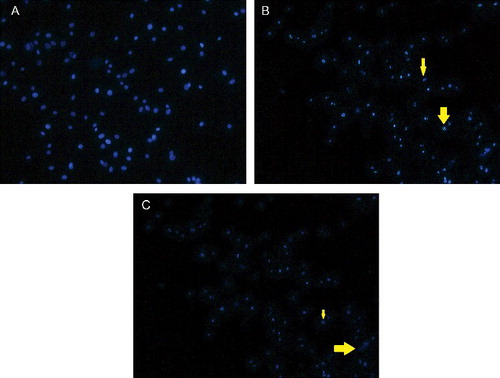
Table 2. Effect of TAM and TAM-loaded SLN at concentration 12 µg/mL on MCF-7 cell cycle distribution.
Table 3. Effect of TAM and TAM-loaded SLN at concentration 16 µg/mL on MDA-MB231 cell cycle distribution.
Table 4. Effect of TAM and TAM-loaded SLN at concentration 15 µg/mL on MCF-7 cell cycle distribution.
Table 5. Effect of TAM and TAM-loaded SLN at concentration 18 µg/mL on MDA-MB231 cell cycle distribution.
Table 6. Effect of TAM and TAM-loaded SLN at concentration 20 µg/mL on MDA-MB231 cell cycle distribution.