Figures & data
Table 1. Water droplet test result.
Figure 1. SEM images of untreated cotton: (a) 500X, (b) 1kX, (c) 2.50kX and (d) 7.50kX.
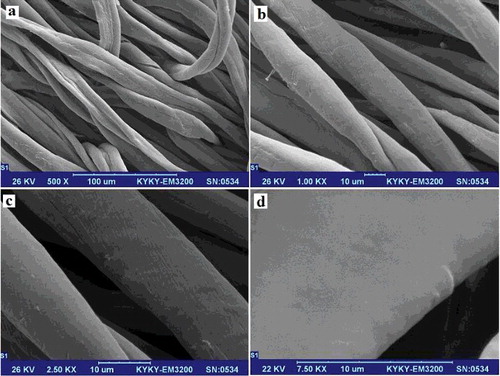
Figure 2. SEM images of 5 minutes air-plasma treated cotton: (e) 1kX and (f) 2.50kX; 5 minutes nitrogen plasma-treated cotton: (g) 1kX and (h) 2.50kX.
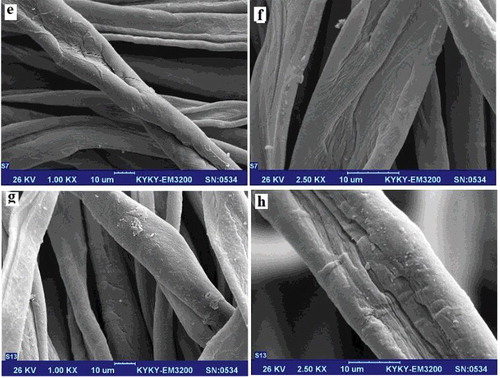
Figure 3. SEM images of CNT inoculated cotton before and after plasma treatment.
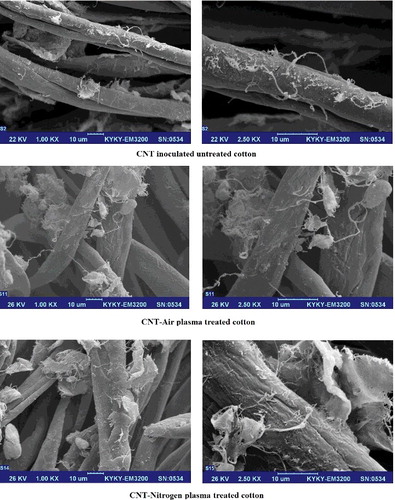
Figure 4. SEM images of washed CNT stabilised cotton.
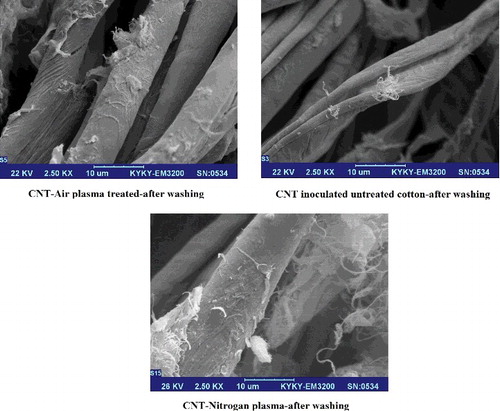
Figure 5. Reflection factor of the untreated, CNT-treated and plasma/CNT-treated samples.
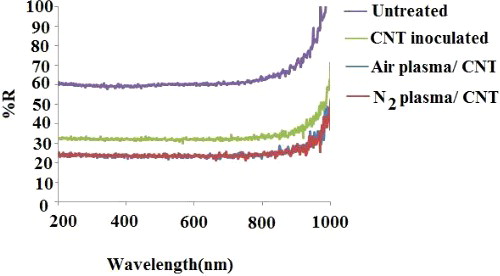
Table 2. Electrical resistance and water absorption time result of untreated and plasma-treated cotton fabrics after CNT inoculation.
Figure 6. Raman spectra of the samples.
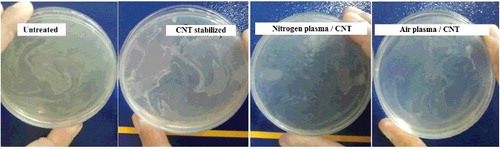
Figure 7. Antibacterial activity of samples.