Figures & data
Table 1. Benefits of nanofluids containing nanoparticles versus microparticles.[Citation3]
Figure 1. Green nanofluids containing gold nanoparticles.
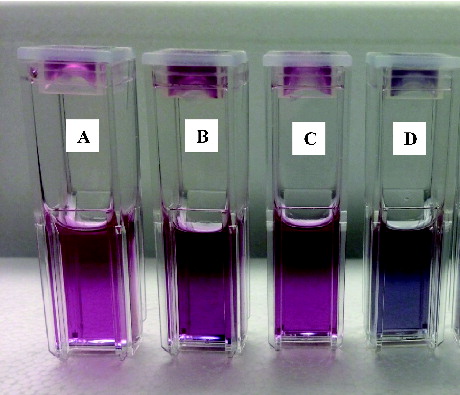
Table 2. Composition of four different nanofluids synthesised using catechin (CAT) and tannic acid (TAE).
Figure 2. DSC thermogram for nanofluids containing AuNP. (a) TAE +AuNP nanofluid; (b) 1:1 CAT:TAE + AuNP nanofluid; (c) 1:4 CAT:TAE + AuNP nanofluid; (d) CAT + AuNP nanofluid; (e) overlay of DSC thermograms for the four AuNP nanofluids.
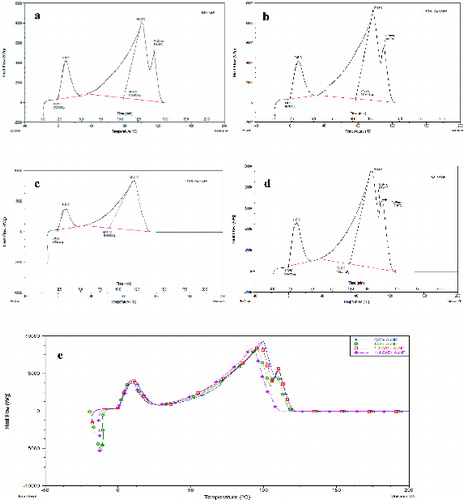
Figure 3. Dielectric properties of green-synthesised AuNP nanofluids. (a) Dielectric constant (ɛ'); (b) dielectric loss factor (ɛ"); (c) dissipation factor (tan δ).
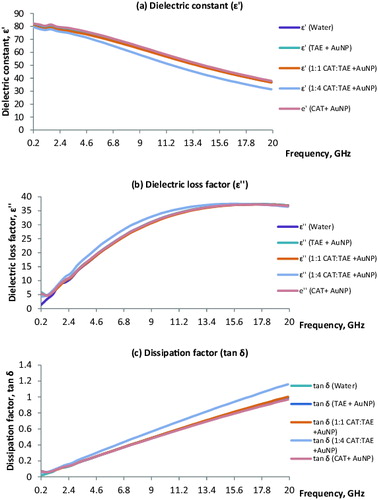
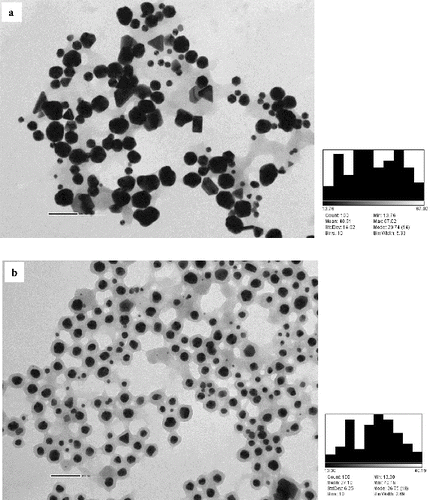
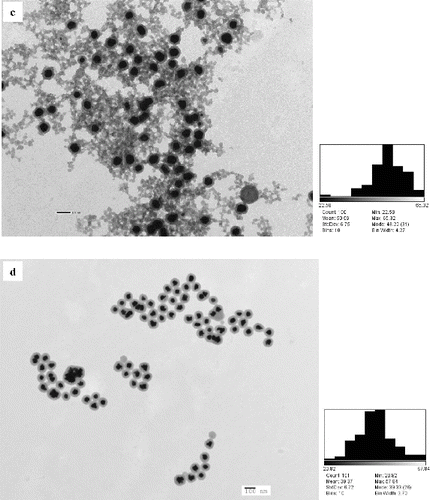
Table 3. Particle size analysis of AuNP size in nanofluids.
Figure 5. UV–vis spectra for gold nanofluids with SPR peak, (a) TAE + AuNP; (b) 1:1 CAT:TAE + AuNP; (c) 1:4 CAT:TAE + AuNP; (d) CAT + AuNP.
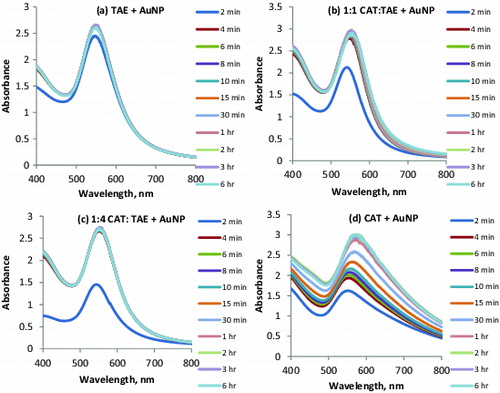
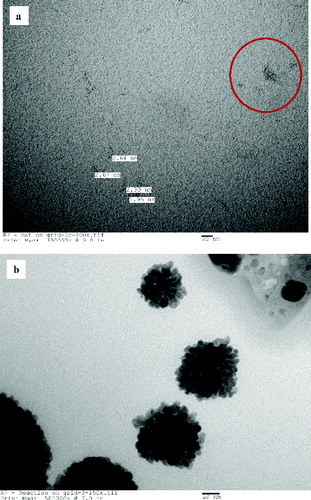
Figure 6. TEM image of CAT + AuNP nanofluid for nucleation study. (a) Catechin on grid and (b) reaction on grid.