Figures & data
Figure 1. UV–vis spectrum of (I) AgNPs and (II) AuNPs obtained from (A) aqueous and (B) methanolic extracts of D. biflorus.
Figure 2. EDX spectra of synthesised (a) AgNPs in aqueous medium, (b) AgNPs in methanolic medium, (c) AuNPs in aqueous medium and (d) AuNPs in methanolic medium.
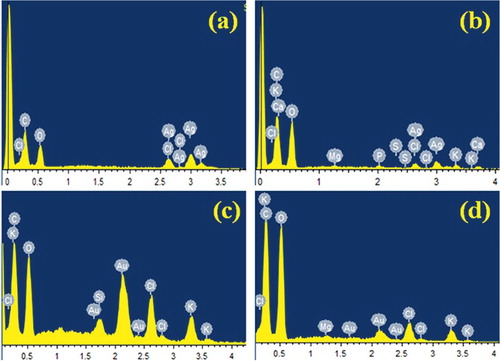
Figure 3. SEM images of (a) AgNPs in aqueous medium, (b) AgNPs in methanolic medium, (c) AuNPs in aqueous medium and (d) AuNPs in methanolic medium.
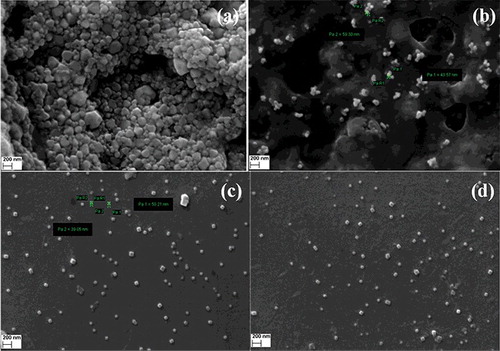
Figure 4. XRD analysis of (I) AgNPs synthesised by (A) D. biflorus aqueous extract and (B) D. biflorus methanol extract; (II) AuNPs synthesised by (A) D. biflorus aqueous extract and (B) D. biflorus methanol extract.
Figure 5. TEM image of the AgNPs distribution inset shows (A) HRTEM image and (B) the SAED patterns of the (111) plane.
Figure 6. TEM image of the AuNPs distribution Inset shows (A) HRTEM image and (B) the SAED patterns of the (111) plane.
Figure 7. Antimicrobial activity against (A) Staphylococcus aureus, (B) Bacillus subtilis, (C) Escherichia coli, (D) Pseudomonas aeruginosa where, (a) AgNPs synthesised in aqueous mediam; (b) AgNPs synthesised in methanol medium; (c) AuNPs synthesised in aqueous medium and (d) AuNPs synthesised in methanolic medium.