Figures & data
Table 1. Selected crystal data of Co(bpy)2(N(CN)2)2.
Table 2. Selected bond lengths (Å) and angles (deg) of Co(bpy)2(N(CN)2)2.
Figure 1. Molecular structure (A) and 3D supra-molecular network (B) of Co(bpy)2(N(CN)2)2.
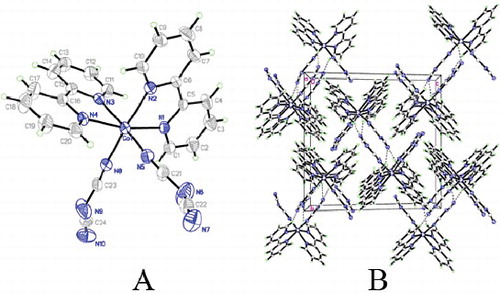
Table 3. Assignment of vibrational modes of Co(bpy)2(N(CN)2)2 and SiO2/Ag-NPs/Co(bpy)2(N(CN)2)2.
Figure 2. XRD pattern of SiO2/Ag-NPs/Co(bpy)2(N(CN)2)2.
Figure 3. SEM image of SiO2/Ag-NPs.
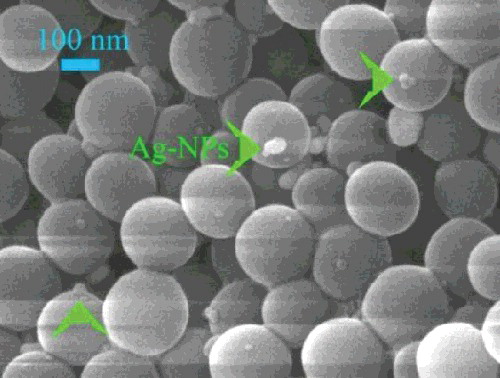
Figure 4. UV–vis spectrum and fluorescence spectrum of Co(bpy)2(N(CN)2)2.
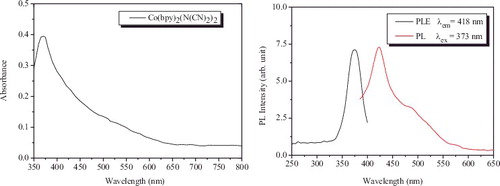
Figure 5. Raman spectra of Co(bpy)2(N(CN)2)2 and SiO2/Ag-NPs/Co(bpy)2(N(CN)2)2.
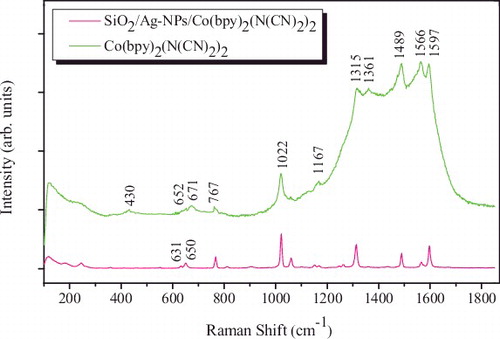
Figure 6. Geometry of Co(bpy)2(N(CN)2)2 molecule absorbed on Ag-NPs surface with sloping adsorption configuration.
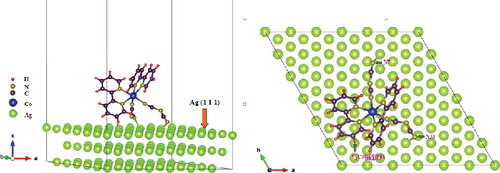
Figure 7. XRD patterns of pyrolysis products at different pyrolysis temperature.
Figure 8. Representative TEM image of carbon dots from light brown supernatant.
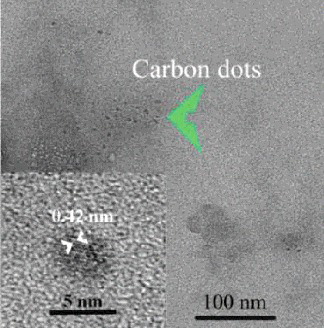
Figure 9. FTIR spectrum of CDs.
Figure 10. XPS spectra of nitrogen-doped CDs for C1s and N1s states.
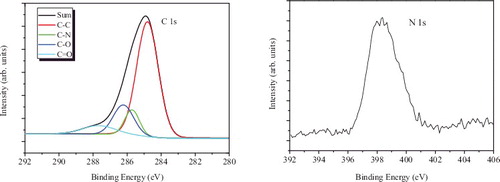
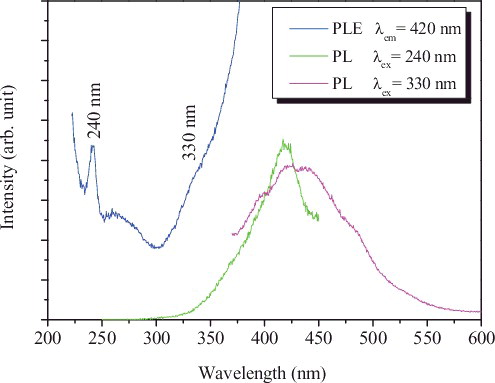
Figure 11. PLE and PL spectra of CDs from light brown liquid.